Beyond the Numbers: How Intentional Text and Human Insight Transform Data Storytelling

The modern workplace is inundated with data visualization, yet organizations frequently struggle to translate raw metrics into actionable operational strategies. Recent analyses in corporate communications and data analytics emphasize that raw charts, no matter how visually polished, rarely drive business outcomes on their own. Instead, transforming a standard graph into a decision-making tool requires a deliberate strategy that combines contextual understanding, precise textual annotation, and human insight—particularly as artificial intelligence assumes a larger role in generating initial analytical drafts.
The Anatomy of an Actionable Data Visualization
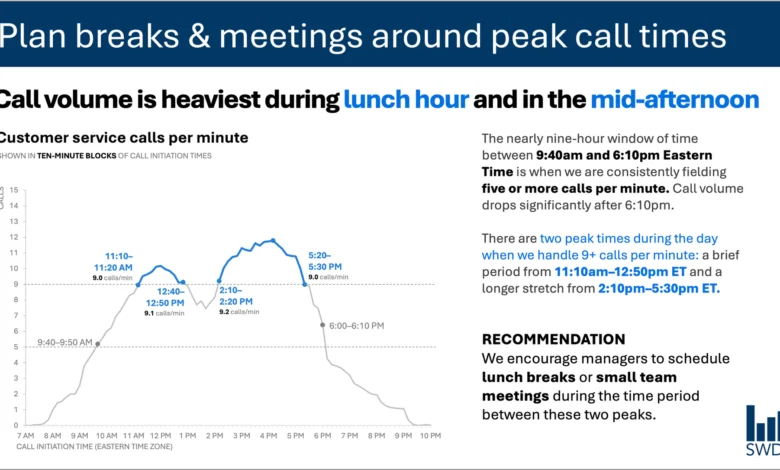
Consider a standard customer service analytics dashboard tracking call volume over the course of a business day. A purely descriptive visualization typically plots calls per minute against a chronological axis, revealing an intuitive pattern: inbound call traffic rises steadily through the morning hours, remains elevated throughout the core of the workday, and reaches pronounced peaks around the traditional lunch hour and mid-afternoon.
Viewed in a vacuum, this graph merely reports chronological activity. However, when the target audience consists of customer service staffing managers, the strategic purpose of the visualization shifts dramatically. The audience is not evaluating the data out of idle curiosity; they are responsible for workforce scheduling, break allocation, and shift management.
Recognizing this operational context alters every element of the visual presentation. Rather than relying on a passive descriptive title, an effective slide employs a directive takeaway title—such as "Plan breaks & meetings around peak call times"—which immediately communicates the operational imperative to the viewer. A secondary descriptive title, such as "Customer service calls per minute," grounds the data, while targeted annotations pinpoint the exact thresholds where volume surges. The final component, a prescriptive recommendation, translates the analytical pattern into a concrete scheduling directive: scheduling lunch breaks and internal team meetings during the lulls between the morning and afternoon peaks.
This methodology challenges the pervasive minimalist philosophy that fewer words automatically equate to better design. While stripping all contextual text from a slide creates a cleaner aesthetic, it strips away utility. Effective communication relies not on arbitrary word reduction, but on ensuring that every piece of text performs a distinct operational job.
Different Words for Different Jobs: A Taxonomy of Graph Text
When designing a data-driven presentation, communicators must assess the specific cognitive needs of the audience. Textual elements within a visualization generally fall into several functional categories, each serving a distinct purpose:
- Takeaway Titles: These statements communicate the primary conclusion or necessary action, moving the audience beyond passive observation to active decision-making.
- Descriptive Titles: These orient the viewer, defining the metrics, timeframe, and scope of the visualized data.
- Direct Labels: By placing data labels directly on or adjacent to series elements, designers eliminate the cognitive friction of cross-referencing a separate legend.
- Annotations: These callouts highlight anomalies, explain underlying causes, or contextualize movements that would otherwise remain ambiguous.
- Reference Data: Axis titles, footnotes, and source citations provide the granular details required for auditing and verification.
Industry standards dictate that not every visualization requires every textual element. The core objective is deliberate design. Analysts must evaluate what the audience needs to comprehend the chart, what actions must be taken as a result, and where specific words can eradicate confusion. Once these priorities are established, extraneous verbiage can be safely excised.
The Intersection of Data Storytelling and Artificial Intelligence
As enterprises increasingly adopt artificial intelligence tools to automate reporting and presentation design, the challenge of data interpretation has taken on new dimensions. When fed historical call-volume data, an advanced language or analytical model can readily detect statistical patterns. It can identify that call volume surges during specific midday windows and generate a grammatically polished summary sentence describing the trend.
However, industry experts caution that generating a descriptive sentence is not equivalent to producing a genuine insight. An artificial intelligence model processes mathematical inputs and historical patterns, but it lacks situational awareness. It does not inherently know who the audience is, what operational constraints govern their decisions, or which regulatory and budgetary factors influence staffing rosters.
This limitation forms the core thesis of modern analytics frameworks, including advanced guidance like the SWD + AI Primer. These frameworks advocate for a collaborative workflow where human analysts supply the vital contextual metadata—audience identity, organizational goals, and operational latitude—before leveraging AI capabilities. Within this division of labor, artificial intelligence excels at mechanical tasks: refining sentence structure, suggesting concise labels, formatting annotations, and rapidly testing alternative phrasings.
Conversely, the human element remains irreplaceable when determining what the data actually means in practice. Employees and managers possess institutional knowledge that algorithms cannot glean from numbers alone. They understand historical anomalies, recent policy shifts, technical outages, and organizational nuances. A sudden spike in customer complaints or call volumes might look statistically identical to a seasonal surge on a chart, yet a human analyst immediately recognizes whether the anomaly stemmed from a software outage or a marketing campaign launch.
Bridging the Gap Between Analytics and Action
Bringing this institutional knowledge to bear on data visualizations requires visibility into the analytical process. The ultimate goal of business intelligence is not to minimize or maximize word count, but to deploy the precise terminology necessary to make analytical reasoning visible to stakeholders.
When organizations bridge the gap between raw data analytics and human-driven context, reporting evolves from a retrospective accounting exercise into a forward-looking operational tool. Staffing managers do not need more charts; they need clarity. By aligning textual annotations, takeaway titles, and prescriptive recommendations with the specific operational realities of the end user, organizations can ensure that data visualization moves beyond abstract aesthetics to genuinely inform enterprise decision-making.
Related posts: