Mastering Data Storytelling: How to Simplify Complex Workforce Analytics for Executive Leadership

In the modern corporate ecosystem, human resources and operations analytics play a foundational role in guiding organizational strategy. However, a persistent challenge for data analysts and internal communicators is translating complex workforce metrics into clear, actionable insights for executive leadership. When preparing forecasts regarding headcount, full-time equivalent (FTE) employees, and departmental shortfalls, analysts frequently succumb to the temptation of cramming exhaustive details into a single, overloaded data visualization. This phenomenon, often analyzed during specialized corporate training sessions such as custom client data storytelling workshops, highlights a critical friction point between data abundance and executive comprehension.
The Pitfalls of Overcrowded Data Visualizations
When executive leadership convenes to review quarterly or annual operational metrics, they require clarity and precision. A forecast predicting an impending staffing shortfall is undoubtedly urgent and warrants immediate escalation. Yet, a bare numeric forecast alone rarely suffices; leaders naturally demand to know the underlying causes of the projected gap.

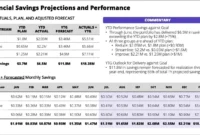
In a recent case study examined during a professional data visualization workshop, a corporate analytics team faced a multifaceted communication challenge. Their objectives were threefold: first, to demonstrate that FTE staffing levels were tracking significantly below the initial corporate plan; second, to highlight that a sharp decline in operations support roles was the primary driver of this variance; and third, to prompt leadership to formulate a strategic resolution.
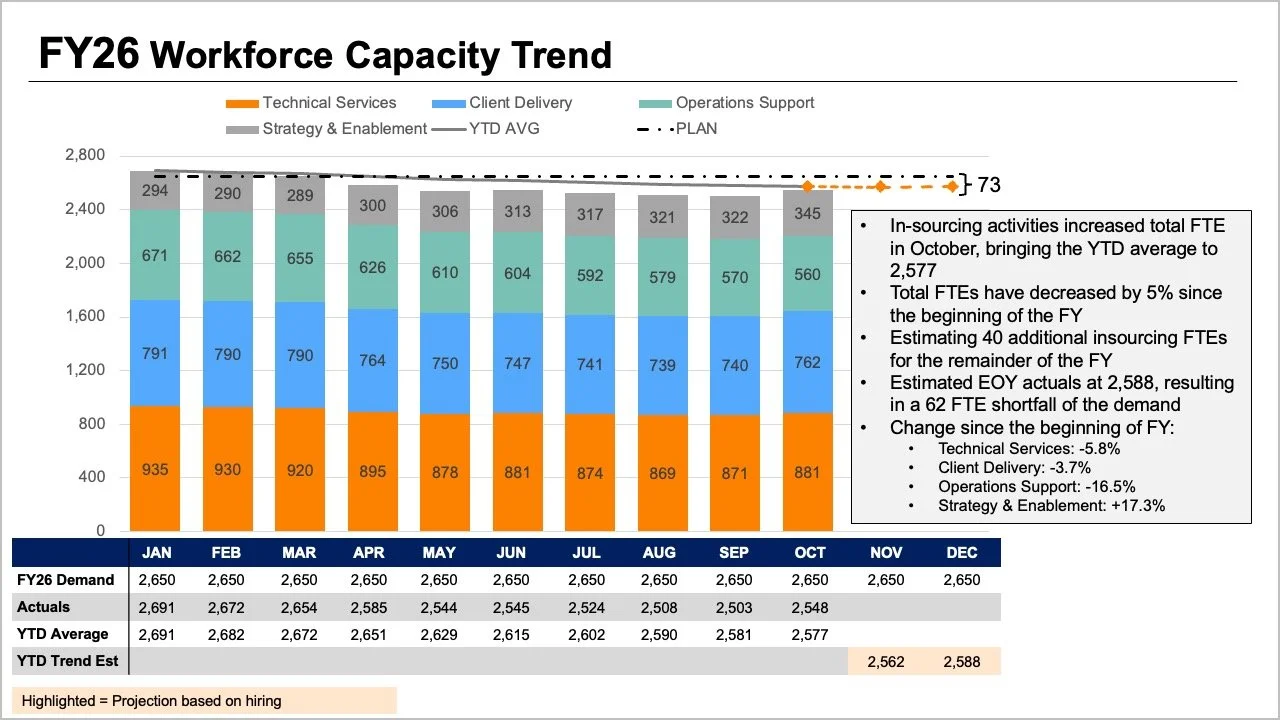
The analytical team possessed all the necessary data points, yet the core message was effectively obscured by the complexity of its presentation. The original briefing slide required readers to process multiple variables simultaneously. The tops of stacked bar charts, overlapping trend lines, and dense accompanying data tables all attempted to communicate overall FTE counts through different visual mechanisms. Simultaneously, internal bar segments depicted role-by-role breakdowns, while additional layers of data—spanning initial plans, actual figures, year-to-date averages, and forward-looking projections—demanded extensive cognitive processing.
Although every individual element on the slide answered a reasonable operational question, bundling them together created a cognitive bottleneck. Executives were forced to decode an intricate matrix of visual signals, hindering their ability to extract the primary takeaways efficiently. Recognizing this friction, data communication experts emphasize that effective visual reporting requires stepping back to evaluate the specific decisions executives must make. In this scenario, leadership needed precise answers to two fundamental questions: How large of an operational shortfall should the enterprise anticipate, and what do the most recent staffing diagnostics reveal regarding where these changes have occurred?
Decoupling Metrics: The Power of the Standalone Line Chart
Rather than forcing every available data point into a single, congested graph, communication strategists recommend dividing the information into distinct, purpose-built visualizations. By dedicating one distinct visual medium to each core question, analysts can drastically reduce cognitive load and accelerate executive decision-making.
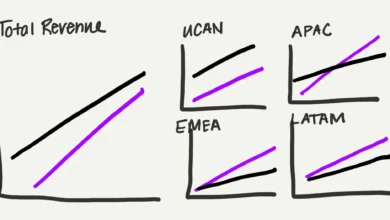
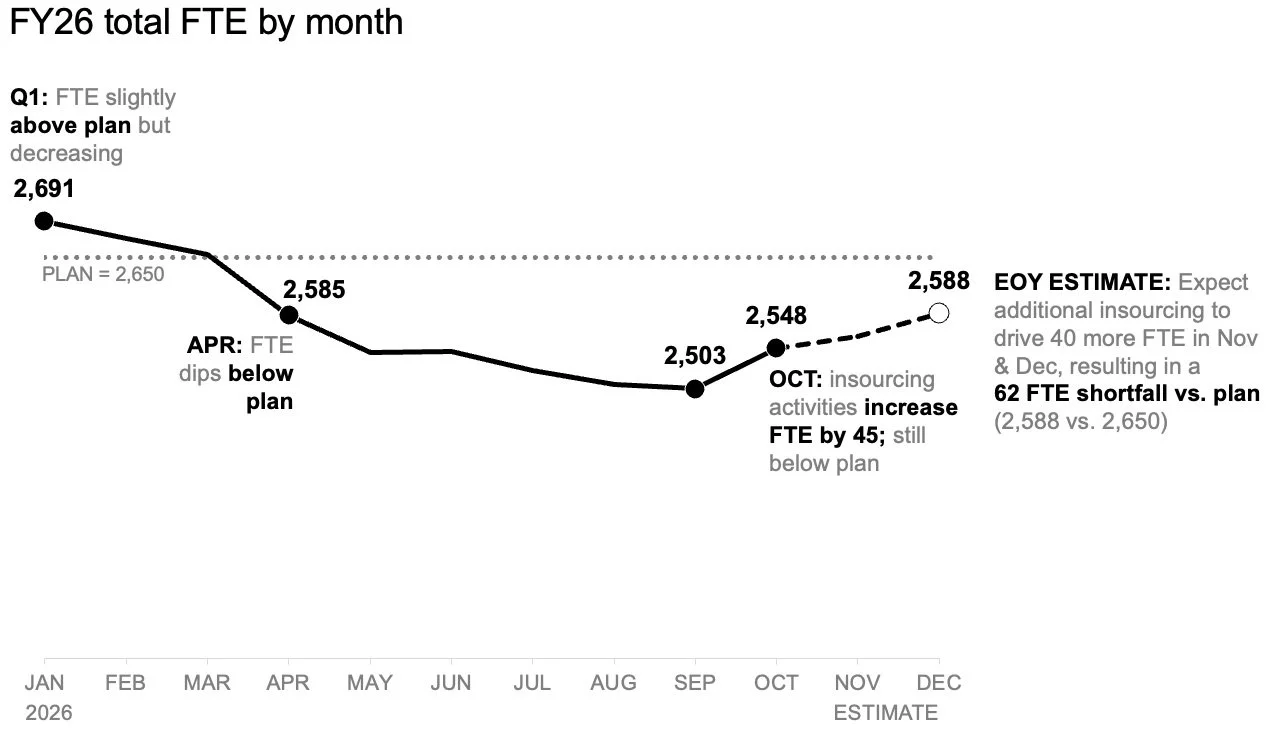
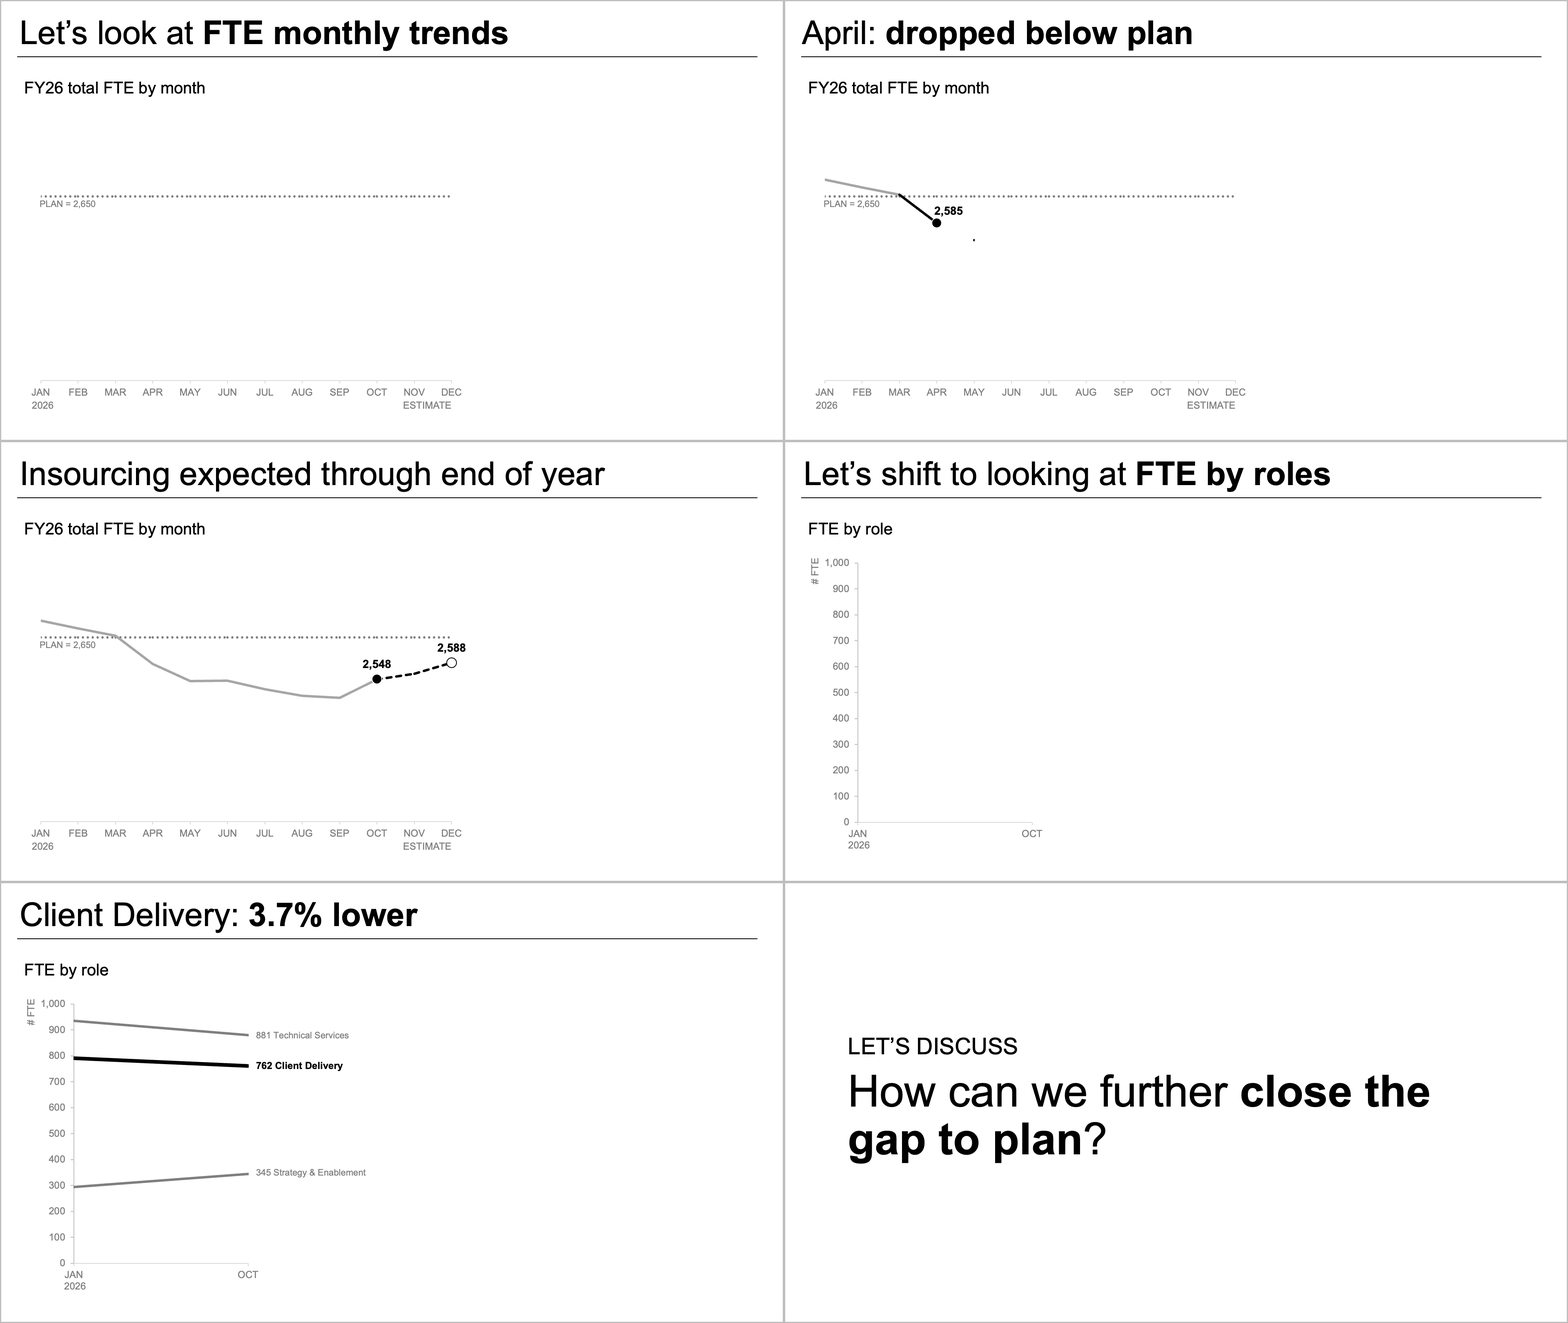
To address the first core question—the magnitude of the anticipated shortfall—analysts can utilize a standalone line chart. This format offers a clean, unobstructed view of how organizational staffing has tracked against the baseline plan established at the beginning of the fiscal year. Furthermore, a dedicated line chart provides clear visibility into how forward-looking projections diverge from those initial targets.
By removing competing variables such as departmental role mixes and dense data tables, the line chart creates valuable visual real estate. Analysts can leverage this space to incorporate strategic annotations at critical inflection points along the timeline. Consequently, executive readers can instantly focus on the projected gap to plan without needing to decode secondary metrics or cross-reference auxiliary tables. This streamlined perspective ensures that discussions regarding resource allocation and budgetary adjustments remain anchored to the core macroeconomic staffing trend.
Visualizing Role-Level Shifts with Slopegraphs
Once the overarching macroeconomic trend has been established, leadership naturally turns its attention to the underlying microeconomic drivers. Understanding the aggregate shortfall is vital, but formulating a targeted remediation strategy requires pinpointing precisely which departments or job classifications experienced the largest operational shifts.
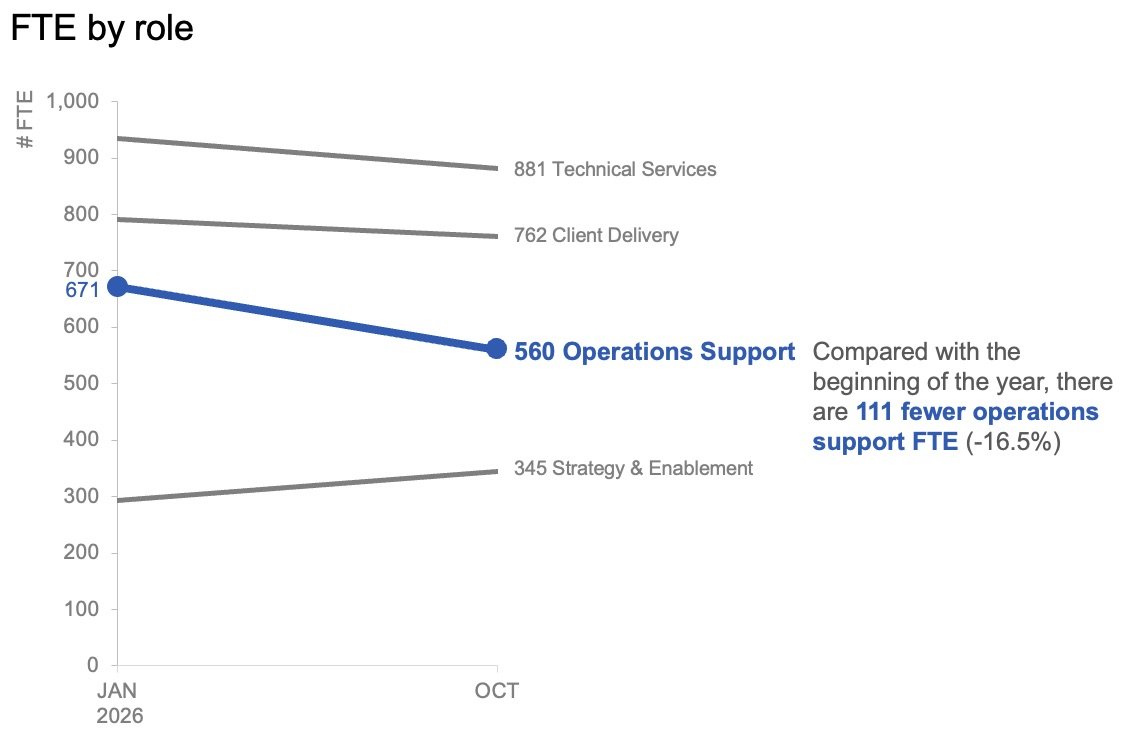
In analyzing role-level variances, traditional month-to-month tracking can sometimes introduce unnecessary noise, as short-term fluctuations obscure structural trends. To mitigate this, data visualization best practices suggest utilizing alternative formats such as slopegraphs. A slopegraph plots data points across two distinct time horizons—such as the start of the fiscal year versus the most recent actual reporting period—connecting them with straight lines to illustrate the rate and direction of change.
Within the context of workforce analytics, plotting only the baseline figures against the latest actual figures provides an immediate, uncluttered overview of role stability. By applying strategic restraint—utilizing color and descriptive text selectively rather than indiscriminately—analysts can naturally draw the audience’s attention toward specific areas of concern, such as a notable contraction in operations support roles. This focused approach ensures that executives immediately grasp which specific segments of the workforce are driving the broader organizational deficit.
Synchronizing Visuals for Static Reports and Live Briefings
The structural separation of macro-level trends and micro-level role breakdowns yields a versatile analytical toolkit that can be adapted for diverse communication mediums. Whether an analytical report is distributed asynchronously via internal memos or presented live in a boardroom setting, modular data design enhances overall comprehension.
For asynchronous communications—such as executive briefing decks distributed via email or reviewed independently by stakeholders—the two complementary views can be unified onto a single digital page or presentation slide. In this layout, a high-impact, takeaway-driven slide title explicitly states the projected staffing shortfall. Below this headline, concise explanatory text highlights the decline in operations support roles and signals the requirement for leadership deliberation. The two standalone charts provide empirical evidence below the text hierarchy without competing for visual prominence.
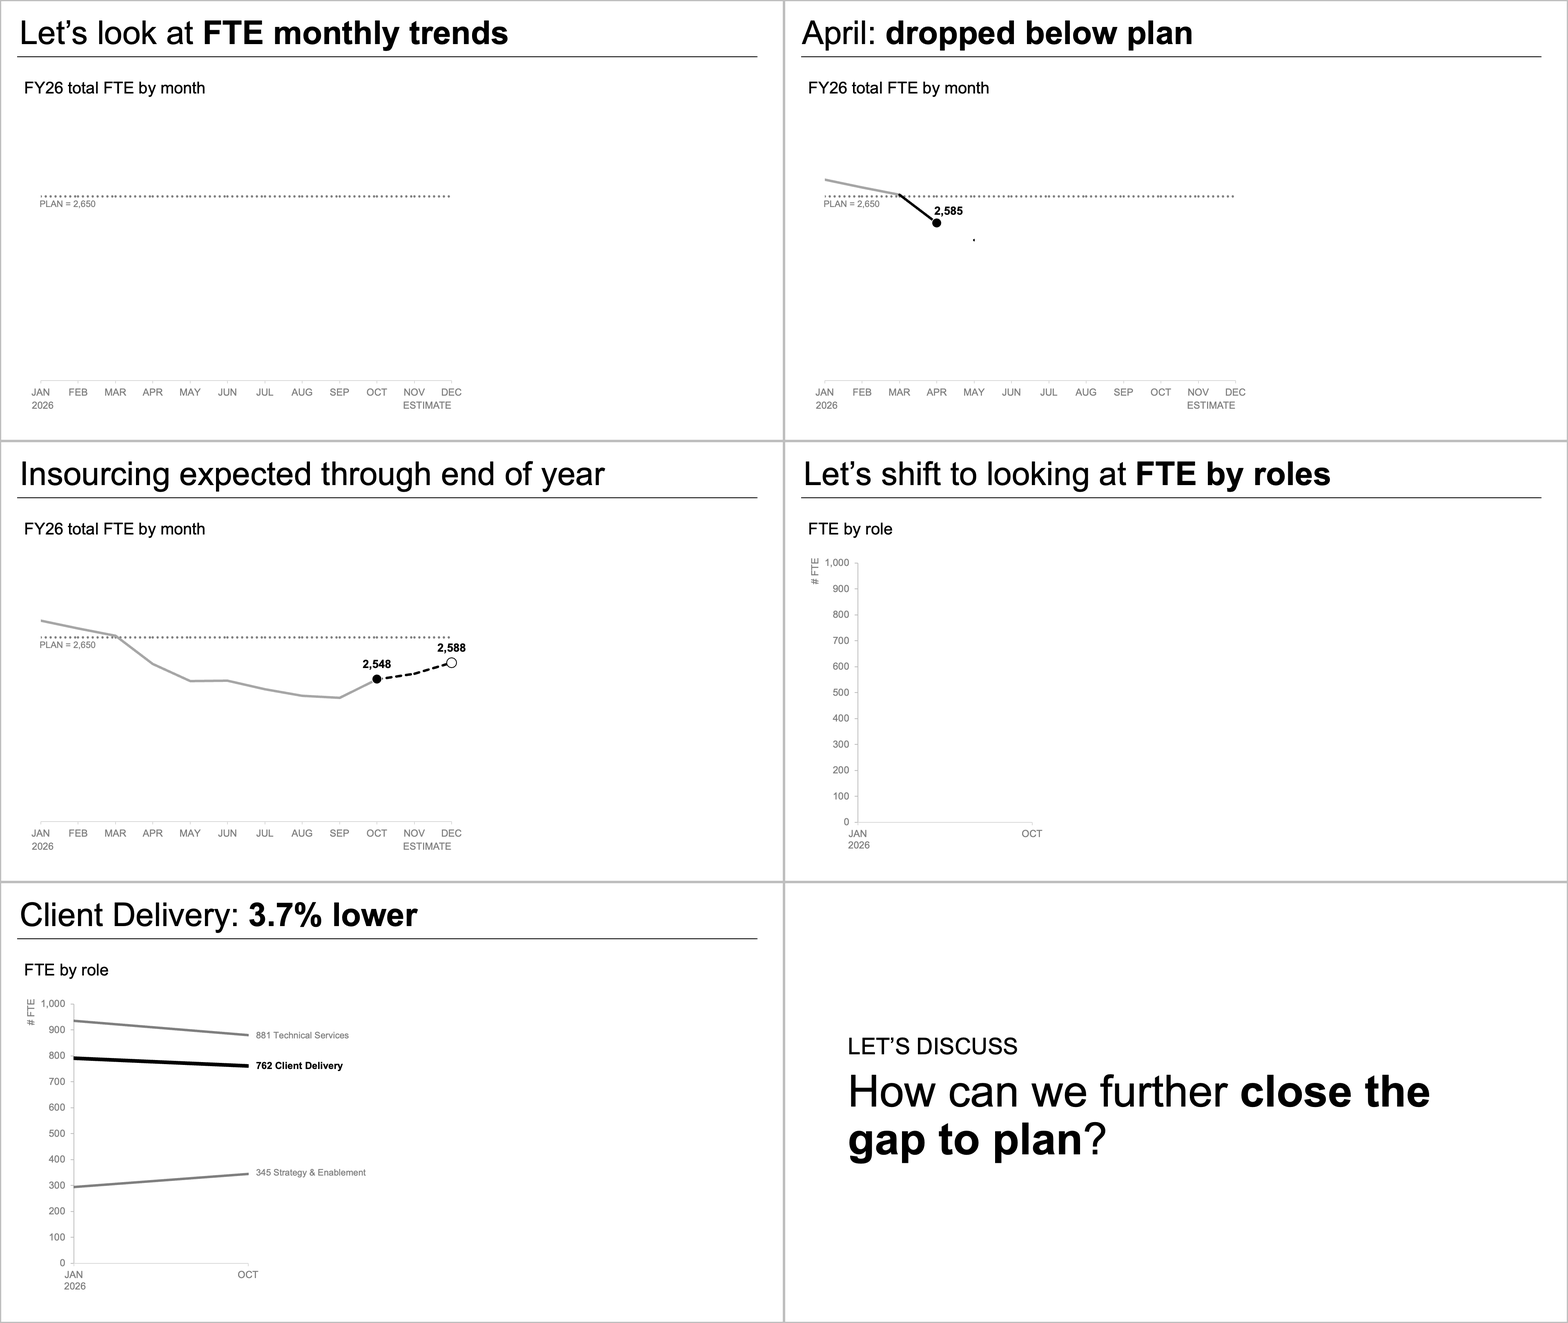
Conversely, live presentations require a temporal sequencing strategy. Presenters should avoid exposing an audience to a comprehensive, multi-part slide all at once while speaking over it. Instead, dynamic presentation techniques allow speakers to reveal information progressively. An analyst can begin by walking the board through the overarching macroeconomic forecast, pause to let the audience absorb the projected shortfall, and subsequently introduce the slopegraph detailing actual role-level shifts. Finally, the narrative can transition naturally into an open discussion concerning strategic remedies. This sequential disclosure mirrors natural human information processing, ensuring that stakeholders remain fully engaged throughout the briefing.
Broader Implications and Strategic Takeaways for Enterprise Analysts
The challenge of balancing data density with clarity is a universal hurdle in corporate governance, human resources management, and financial planning. As enterprises collect increasingly granular datasets, the primary bottleneck in decision-making has shifted from data scarcity to data interpretation.
When analysts attempt to achieve absolute comprehensiveness within a single chart, they frequently undermine the persuasive power of their findings. The core lesson of modern data storytelling is that efficiency in design does not equate to packing maximum data points into minimal space. True efficiency is achieved when data visualizations are intentionally engineered to match the cognitive workflows of decision-makers.
By dividing complex workforce narratives into distinct, question-driven views—such as pairing an annotated trend line for overall projections with a slopegraph for granular role shifts—organizations can bridge the gap between raw data and executive action. Ultimately, transforming dense operational analytics into focused, digestible visual narratives empowers leadership to navigate workforce challenges with precision, confidence, and strategic agility.