Mastering Data Storytelling and Presentation Design with Integrated Artificial Intelligence Tools


The intersection of artificial intelligence and professional corporate communication has reached a critical juncture with the introduction of advanced workflow methodologies designed to bridge the gap between raw data analysis and compelling presentation design. As organizations increasingly rely on data-driven decision-making, the demand for clear, concise, and persuasive visual storytelling has never been higher. Professionals across various industries frequently encounter a significant bottleneck in their workflows: transforming raw, unpolished data outputs from analytical tools or early-stage AI generators into presentation-ready assets that effectively capture audience attention and drive actionable outcomes.
To address this persistent challenge, industry standards are shifting away from static, standalone prototypes toward deeply integrated artificial intelligence ecosystems embedded directly within standard productivity suites such as Microsoft PowerPoint. This evolution allows creators to bypass the tedious manual labor of foundational slide construction and instead focus on high-level strategic refinement. By combining established human-centric design philosophies—such as those popularized by the Storytelling with Data (SWD) framework—with modern generative AI capabilities, corporate communicators can significantly reduce the time required to produce polished, editable presentations from hours to mere minutes.
Background Context of the Integration of AI in Data Design
For decades, the standard procedure for building data-heavy presentations involved a disjointed sequence of operations. Analysts would extract data, generate default charts using spreadsheet software, export those visuals into presentation platforms, and manually spend hours stripping away unnecessary visual elements, aligning text boxes, and redesigning color schemes to match corporate identity guidelines. This process often resulted in cognitive fatigue and inconsistent design quality across organizational deliverables.
The advent of generative artificial intelligence initially promised relief, yet early implementations often introduced new friction. Generative tools frequently produced static image files rather than native, editable slide objects, requiring users to manually rebuild charts from scratch to implement necessary corrections. Furthermore, unguided AI models historically lacked an understanding of foundational visual hierarchy, cognitive load theory, and strategic framing, frequently generating cluttered slides overloaded with redundant information, default gridlines, and confusing color palettes.
Recognizing these limitations, recent advancements in artificial intelligence integration have shifted focus toward contextual grounding and native application compatibility. By providing AI models with specialized instructional primers—such as comprehensive guides on cognitive load reduction, strategic visual alignment, and intentional color theory—users can fundamentally alter how AI interprets design prompts. When paired with native integration inside platforms like Microsoft PowerPoint, modern AI assistants can now generate fully editable vector graphics, structured text layouts, and compliant branding elements that align directly with corporate guidelines.
Chronology of the SWD and AI Framework Implementation
The systematic integration of artificial intelligence into structured data storytelling methodology has rolled out across a series of structured phases designed to mirror the cognitive workflow of professional analysts and communicators.
Phase 1: Contextual Foundation and Audience Identification
The initial deployment phase focuses heavily on establishing contextual parameters. Before any visual design or data aggregation occurs, communicators must explicitly define their target audience, identify their specific informational needs, and articulate a singular core message, frequently referred to as the "Big Idea." This foundational step ensures that subsequent technological interventions serve a precise communicative purpose rather than merely decorative functions.
Phase 2: Narrative Arc and Story Structuring
Once the contextual foundation is established, the workflow progresses into narrative architecture. This stage involves mapping out the sequence of information to guide the audience logically from the current state to a proposed resolution or call to action. By structuring the narrative before designing individual slides, creators prevent the common pitfall of letting available data dictate the story, ensuring instead that the data supports a coherent overarching argument.
Phase 3: Visual Selection and Prototyping
With a clear narrative established, communicators select appropriate visual representations—such as simple bar charts, slope graphs, or targeted tables—that best illustrate specific data relationships. In this phase, AI acts as an initial thought partner, helping to generate rapid prototypes and explore alternative visual formats that might effectively communicate the underlying data points without introducing unnecessary complexity.
Phase 4: Integrated Slide Design and Refinement
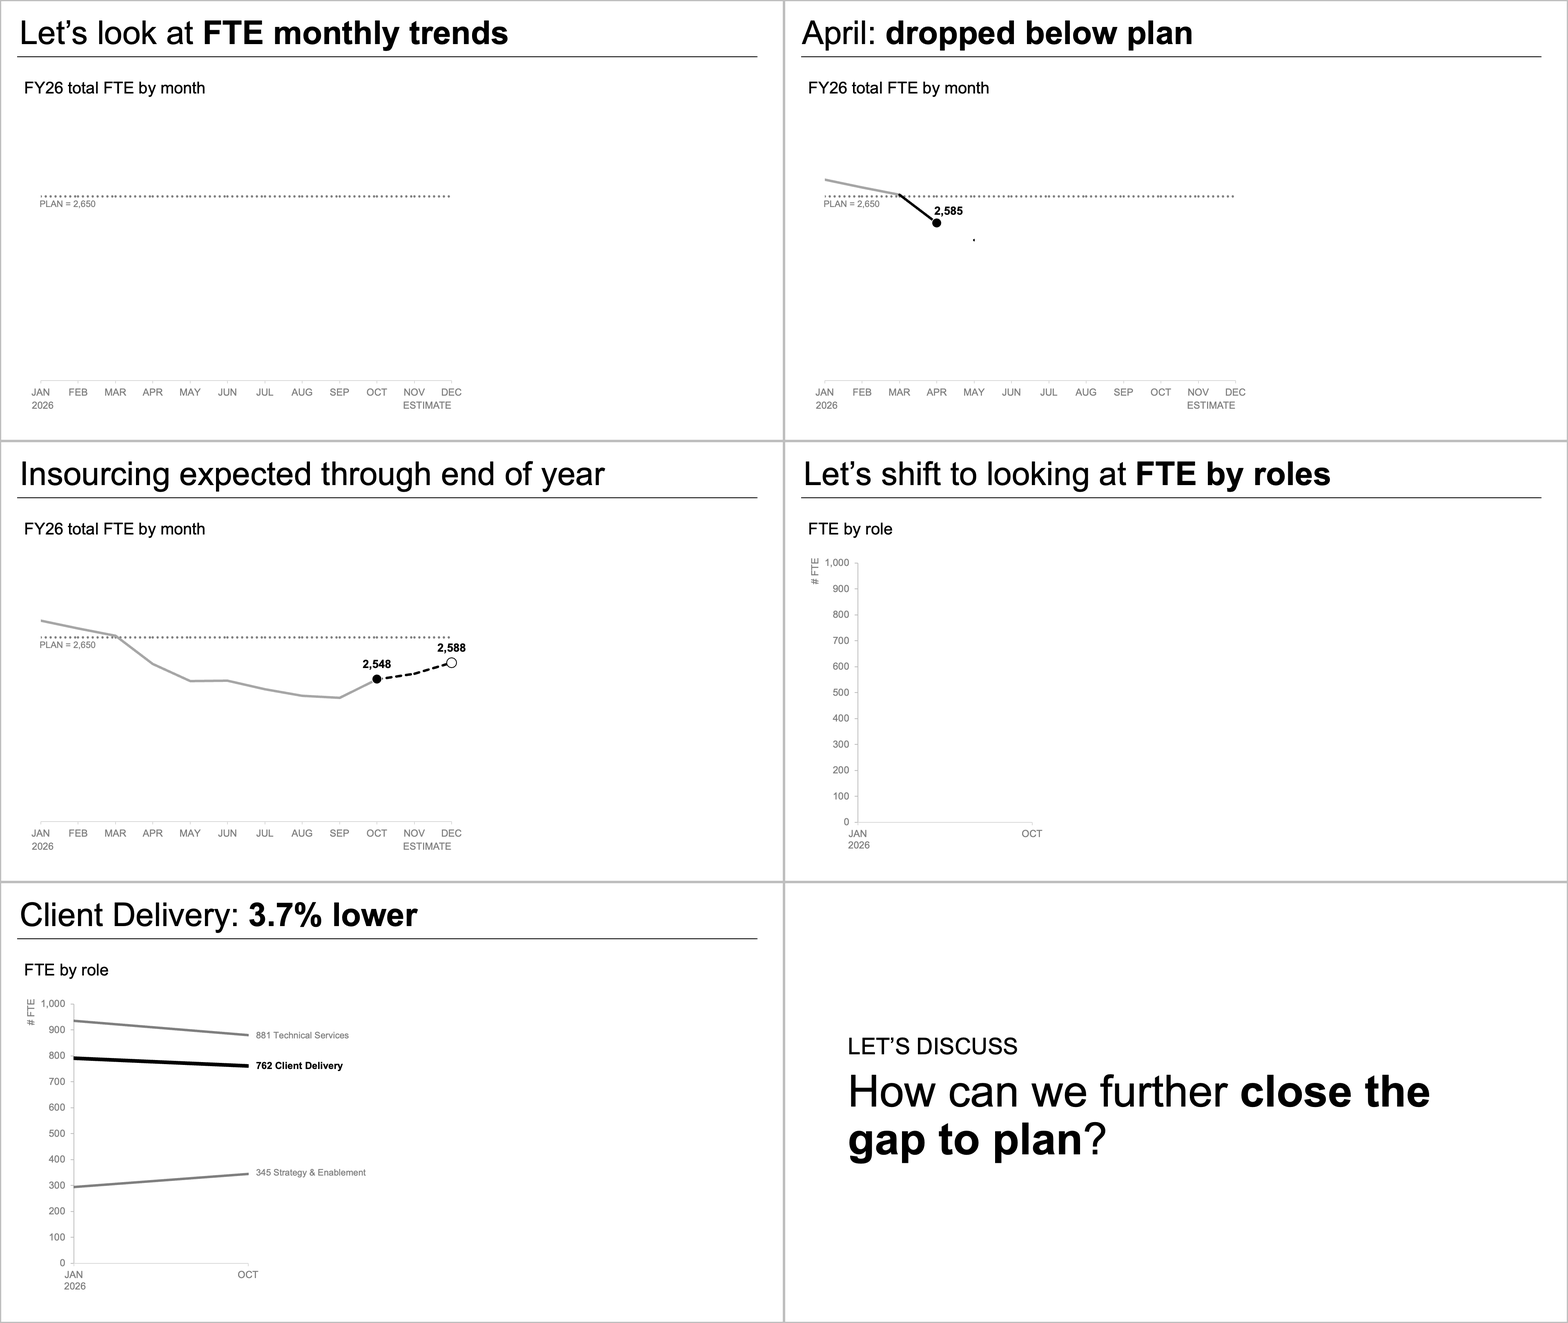
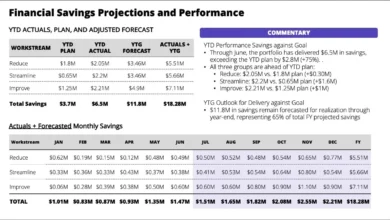
The current milestone in this ongoing methodological evolution centers on active slide design and execution. Moving beyond theoretical prototyping, this phase utilizes AI assistants embedded directly into presentation software to generate editable slides. Practitioners feed structured data and contextual prompts into tools like Microsoft Copilot, leveraging specialized design primers to produce clean, structured, and compliant visual layouts that require minimal manual intervention.
Supporting Data and Industry Metrics on Visual Communication
Empirical research in cognitive psychology and corporate communications consistently highlights the tangible impact of effective visual design and structured data presentation. Studies on cognitive load theory demonstrate that human working memory is severely limited when processing simultaneous visual and textual information.
Industry benchmarks indicate that presentations cluttered with redundant gridlines, decorative chart borders, and unannotated data points increase audience processing time by up to forty percent while significantly decreasing message retention. Conversely, data visualizations that successfully eliminate extraneous elements—often referred to in professional design as reducing cognitive load—demonstrate a marked improvement in decision-making speed among executive audiences.
Furthermore, corporate workflow audits reveal that knowledge workers spend an estimated twenty to thirty percent of their total presentation-preparation time on formatting, alignment, and aesthetic adjustments rather than substantive analytical work. Implementing AI-driven design workflows that automate the initial ninety percent of layout generation allows organizations to reclaim hundreds of hours of productivity annually, redirecting vital human capital toward strategic analysis and stakeholder engagement.
Official Responses and Industry Reception
Professional communication experts and organizational leaders have responded favorably to the integration of natively editable AI tools within standard corporate software environments. Analysts note that the distinction between static image generation and native object creation represents a major milestone for enterprise adoption.
Corporate design and communications departments, which historically viewed generative AI with skepticism due to concerns over brand consistency and visual quality, have increasingly embraced framework-guided AI utilization. By incorporating organizational brand guidelines, color palettes, and typography standards directly into the AI prompting process, enterprises can maintain strict visual governance while empowering non-designer employees to produce high-caliber visual communications.
Management consultants and enterprise training organizations have also highlighted the pedagogical value of structured AI prompts. Rather than replacing human judgment, tools utilizing foundational primers serve as real-time coaches, educating everyday professionals on core design principles such as intentional alignment, strategic contrast, and clear typographic hierarchy through interactive application.
Broader Impact and Strategic Implications
The widespread adoption of integrated, AI-assisted presentation design carries profound implications for organizational communication and operational efficiency across the global business landscape. As executive leadership teams face increasingly complex data landscapes and compressed decision-making timelines, the ability to communicate insights rapidly and unambiguously becomes a distinct competitive advantage.
By democratizing access to professional-grade design principles through intelligent software assistants, organizations can elevate the baseline quality of internal and external reporting. Miscommunications stemming from poorly formatted data, ambiguous chart titles, or overwhelming visual clutter can be systematically mitigated, fostering a more transparent and data-literate corporate culture.
At the same time, this technological shift underscores the irreplaceable value of human critical thinking and contextual judgment. While artificial intelligence excels at executing mechanical tasks—such as aligning text boxes, removing default gridlines, and generating initial structural layouts—the final ten percent of refinement remains firmly in the hands of the human communicator. It is the human author who ultimately determines whether a slide resonates emotionally, accurately reflects organizational nuances, and successfully motivates an audience to take decisive action.