Mastering the Art of Data Storytelling: Five Core Competencies for the Modern Professional


Effective data communication has emerged as one of the most critical yet challenging competencies in the contemporary workforce, prompting professionals to continually seek methods to translate complex metrics into compelling narratives. In an era where organizations are increasingly driven by quantitative insights, the ability to bridge the gap between raw data and human understanding remains paramount. Analysts, managers, and executives frequently find themselves overwhelmed by the myriad skills required to present information persuasively—ranging from graphic design and psychological audience analysis to narrative structuring and public speaking.
Rather than attempting an impossible, simultaneous mastery of every facet of data presentation, industry experts suggest a more targeted approach. By identifying the single competency that yields the highest return on investment for a professional’s current projects, practitioners can streamline their learning curve. This strategic shift in perspective gained significant traction following a comprehensive review of the popular storytelling with data podcast, which recently celebrated its milestone 100th episode. By analyzing the curriculum of a century of expert interviews and tactical deep dives, researchers and communications specialists have categorized the entire discipline into five distinct, actionable pillars designed to address specific professional growing pains.
Background Context and the Evolution of Data Communication
The exponential growth of big data over the past two decades has fundamentally transformed decision-making processes across the corporate, governmental, and non-profit sectors. According to recent industry benchmarks from enterprise analytics firms, over 90 percent of global organizations report that data-driven insights are central to their strategic planning. However, a persistent bottleneck remains: while the generation and collection of data have scaled exponentially, the human capability to interpret and act upon that information has lagged significantly.
Historically, data presentation relied heavily on dense spreadsheets, standardized corporate dashboards, and overly complex statistical models designed by analysts for other analysts. This insular approach frequently alienated decision-makers, leading to analysis paralysis and missed strategic opportunities. The discipline of data storytelling emerged to counter this deficit, merging the scientific rigor of data analysis with the persuasive power of narrative structure.
As the discipline matured, the educational landscape surrounding it expanded rapidly. Professionals no longer needed convincing that data mattered; instead, they sought guidance on how to execute it effectively. The storytelling with data podcast was established to meet this demand, capturing insights from thought leaders, Chief Data Officers, visualization pioneers, and corporate communicators. Reaching the 100-episode mark provided a unique archival opportunity to synthesize years of qualitative research into a cohesive framework that addresses the varied skill sets of a modern workforce.
Methodology: Shifting from Favorite Episodes to Practical Recommendations
In evaluating the repository of 100 episodes, the editorial and production teams deliberately avoided a subjective ranking based merely on listener popularity or production quality. Instead, they adopted a utilitarian metric: "When would you recommend this specific episode to a colleague?"
This shift in criteria transformed a retrospective list into a practical diagnostic tool. By examining the professional scenarios that prompt a recommendation—such as a junior analyst struggling with chart clutter, a mid-level manager preparing for an executive board meeting, or a team lead designing an enterprise-wide reporting strategy—the team mapped out five distinct learning stages. This taxonomy ensures that learners do not drown in generalized advice, but rather match their immediate professional challenges to precise, targeted resources.
Pillar One: Building the Foundational Base
For professionals relatively new to the realm of data visualization and communication, the initial hurdle is often understanding what constitutes high-quality work. Beginners frequently fall into the trap of overcomplicating visuals, utilizing default software settings that generate clutter, or failing to establish a clear visual hierarchy.
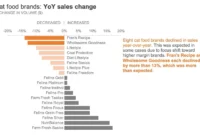
At this foundational stage, practitioners must focus on core mechanical principles: selecting appropriate chart types, aggressively removing visual noise, utilizing color with deliberate intent rather than mere decoration, and strategically directing the audience’s gaze to the most critical data points. Clarity must always supersede cleverness.
Industry veterans emphasize that theoretical knowledge must be immediately paired with practical execution. In a foundational episode of the podcast, data visualization expert Andy Cotgreave introduced a guiding philosophy that continues to resonate across the industry: create, create, create. Waiting until one feels entirely competent before publishing a chart or slide deck is a common trap that stalls professional growth.
Chronology of Skill Acquisition and Iterative Practice
The learning curve for data communication typically follows a predictable chronological trajectory for most corporate professionals. The following phases outline the typical evolution from novice to advanced communicator:
- Phase One (Months 1–6): The Mechanical Stage. Professionals focus on technical execution, software proficiency (such as Excel, Tableau, or Power BI), and basic design hygiene. The primary goal is eliminating distracting chart junk and ensuring accurate data representation.
- Phase Two (Months 6–18): The Contextual Stage. Practitioners begin looking beyond the software defaults to consider the audience. They learn to define the specific "big idea" of their presentation and tailor the level of detail to the consumer’s needs.
- Phase Three (Months 18–36): The Narrative Stage. Communication shifts from static reporting to dynamic storytelling. Professionals integrate narrative arcs, tension, and resolution into their quantitative presentations, guiding stakeholders toward decisive action.
- Phase Four (Years 3+): The Strategic and Leadership Stage. At the highest level, data leaders architect organizational reporting cultures, mentor junior staff, and govern how metrics are communicated across entire enterprises.
The Importance of Rapid Prototyping and the Value of Imperfection
A critical finding from the retrospective analysis of the podcast archives is the psychological barrier many beginners face regarding imperfection. Early-career analysts often experience acute anxiety when sharing work that lacks polish. However, empirical observations from mentoring programs indicate that rapid, iterative creation accelerates competency far faster than protracted, solitary planning.
When an analyst produces a flawed visualization and receives constructive critique, the cognitive pathways for retention are significantly reinforced. The realization that an early work is suboptimal—often accompanied by a feeling of mild embarrassment—serves as objective proof of ongoing cognitive development and skill refinement. Embracing this iterative cycle allows professionals to transition smoothly from the foundational stage to more advanced narrative techniques.
Official Responses and Industry Perspectives
Corporate learning and development (L&D) executives have increasingly incorporated data storytelling modules into their onboarding and upskilling programs. According to a recent survey conducted by corporate human resources associations, over 75 percent of Fortune 500 companies have implemented specialized training aimed at improving data literacy among non-technical staff.
"The demand for data literacy is no longer confined to the data science department," notes Dr. Elena Vance, a corporate communications researcher. "Every department head, marketing manager, and human resources specialist is now expected to justify budgets and strategic initiatives using quantitative evidence. If you cannot translate that evidence into a narrative that engages human emotion and logic, the data remains inert."
Industry leaders emphasize that foundational training must be accessible to all employees, regardless of their quantitative background. By breaking down data communication into discrete, manageable skills—such as those identified in the five-pillar framework—organizations can systematically dismantle the intimidation factor often associated with analytics.
Broader Impact and Strategic Implications
The implications of improving organizational data communication extend far beyond cleaner slide decks and more aesthetically pleasing dashboards. At an enterprise level, effective data storytelling directly correlates with operational efficiency, risk mitigation, and faster decision-making cycles.
When reports are cluttered, ambiguous, or poorly structured, executive leadership spends valuable time deciphering the underlying metrics rather than debating the strategic implications. Conversely, when data is communicated with absolute clarity and narrative coherence, alignment is achieved rapidly. This reduction in friction minimizes the risk of misinterpretation, ensuring that capital allocation, operational adjustments, and strategic pivots are executed based on shared, unambiguous understanding.
Furthermore, fostering a culture of effective data communication enhances employee engagement. Analysts feel a greater sense of purpose when they see their quantitative models successfully driving business outcomes, while decision-makers feel empowered rather than overwhelmed by incoming metrics.
Looking Ahead: The Future of Quantitative Narratives
As artificial intelligence and automated analytics platforms assume a greater share of routine data processing and visualization generation, the human element of data storytelling will only increase in value. Software can effortlessly generate a hundred different charts from a dataset, but determining which chart matters, understanding the nuances of the audience, and weaving the output into an ethical, persuasive narrative remains a uniquely human endeavor.
Professionals who take the time to audit their current skill sets—asking themselves what specific competency would make the greatest impact on their work today—position themselves advantageously in a data-saturated economy. By engaging with structured educational resources, embracing the iterative nature of creative practice, and focusing deliberately on foundational clarity before advancing to complex narratives, the modern workforce can successfully bridge the gap between numbers and meaningful action.