Unlocking Advanced Geospatial Intelligence: Amazon QuickSight Expands Layer Maps with Point and LineString Geometry Support

Business intelligence and data visualization have entered a new era of spatial precision following the deployment of a major update by Amazon Web Services (AWS) to its unified business intelligence service, Amazon QuickSight. Enterprises relying on cloud-based analytics can now leverage enhanced layer map capabilities that incorporate explicit Point and LineString geometry types within standard GeoJSON workflows. This technological progression addresses a critical historical limitation in business mapping: the ability to visualize not only regional boundaries and sales territories, but also the individual assets residing within those regions and the dynamic routes connecting them.
The integration of advanced geospatial metrics represents a vital evolution in how organizations analyze spatial data. Historically, geographic information systems (GIS) and business intelligence platforms forced organizations to choose between macro-level regional aggregations—such as postal codes, sales districts, and state boundaries—and micro-level asset tracking. By merging these capabilities into a single, cohesive dashboard ecosystem, Amazon QuickSight bridges the gap between regional performance analytics and granular operational tracking. Industry analysts note that this capability is particularly transformative for logistics, retail operations, transportation networks, and supply chain management, where the interplay between fixed facilities and mobile assets dictates operational efficiency.
Evolution of Geospatial Mapping in Business Intelligence

The initial rollout of layer maps in Amazon QuickSight introduced custom shape layers through uploaded GeoJSON files, enabling companies to map complex polygons like sales territories, municipal districts, and international shipping lanes. While highly effective for visualizing area-based performance and regional densities, this framework lacked the structural capacity to plot individual stores, field service technicians, or precise transit corridors directly onto the same spatial canvas.
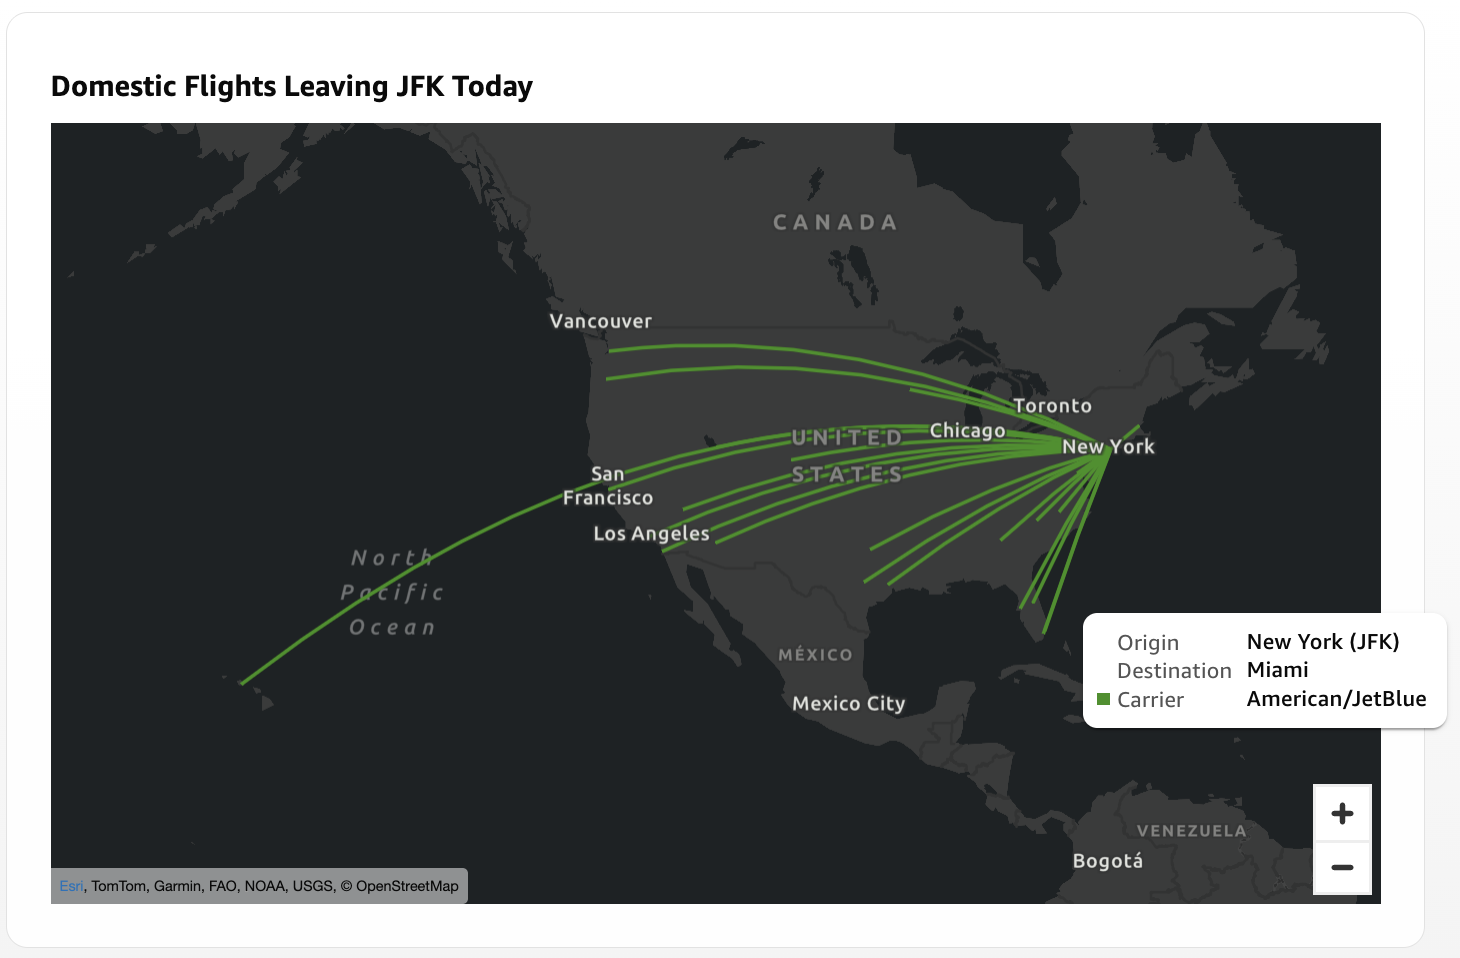
Recognizing these operational bottlenecks, AWS engineers expanded the underlying mapping engine to interpret additional geometry types from the standard GeoJSON specification: Point and LineString features. A Point geometry successfully marks localized nodes, including retail storefronts, warehouse facilities, cell towers, or distribution centers. Conversely, a LineString geometry connects an ordered sequence of coordinates to trace linear paths, such as commercial flight trajectories, freight shipping lanes, utility pipeline networks, or last-mile delivery routes.
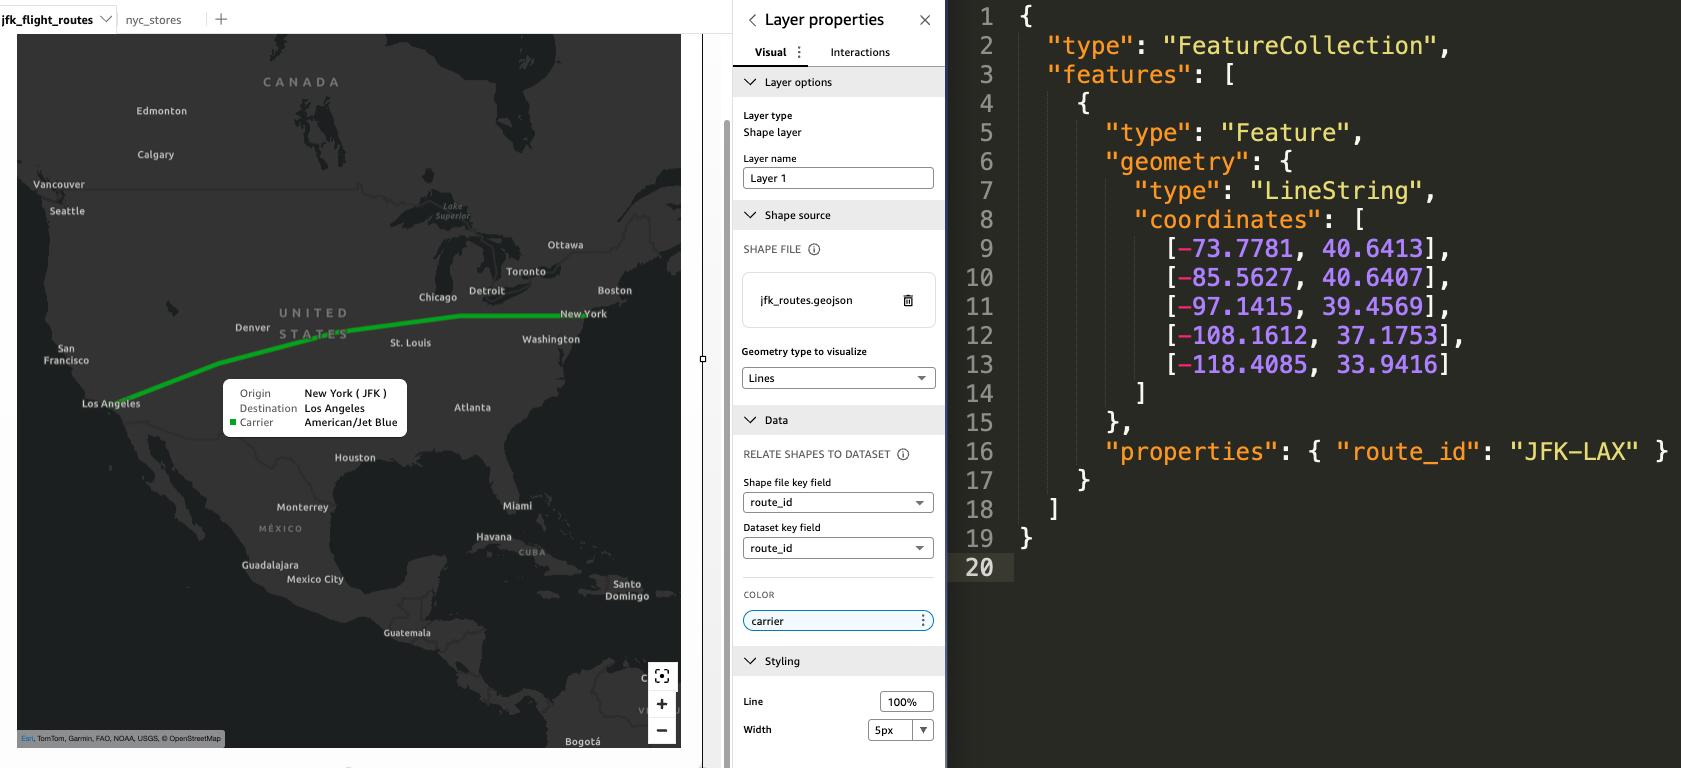
To operationalize these features, administrators configure a shared key mechanism that links spatial elements in the GeoJSON file to corresponding rows in an Amazon QuickSight dataset. For instance, a logistics enterprise can maintain a dataset where each row corresponds to a specific delivery truck route identified by a unique route ID. By matching this dataset field with the properties object inside a corresponding LineString GeoJSON feature, the platform renders the exact physical path of the vehicle while dynamically pulling real-time metrics—such as fuel consumption, driver identity, or package volume—into interactive tooltips and color-coded visual filters.
Comparative Analysis: Layer Maps Versus Native Point Maps

A central consideration for business intelligence architects is determining when to deploy layer map points versus Amazon QuickSight’s native point map visual type. While both visualize coordinate-based data, their underlying architectures and use cases differ significantly.
Native point maps rely on automated geocoding or direct latitude and longitude values residing directly within the dataset. These maps excel in dynamic environments where location data updates frequently through scheduled Amazon SPICE refreshes or Direct Query connections. They automatically scale, cluster, and render heatmap density gradients based on real-time database changes, making them ideal for high-velocity IoT monitoring or rapidly expanding customer databases.
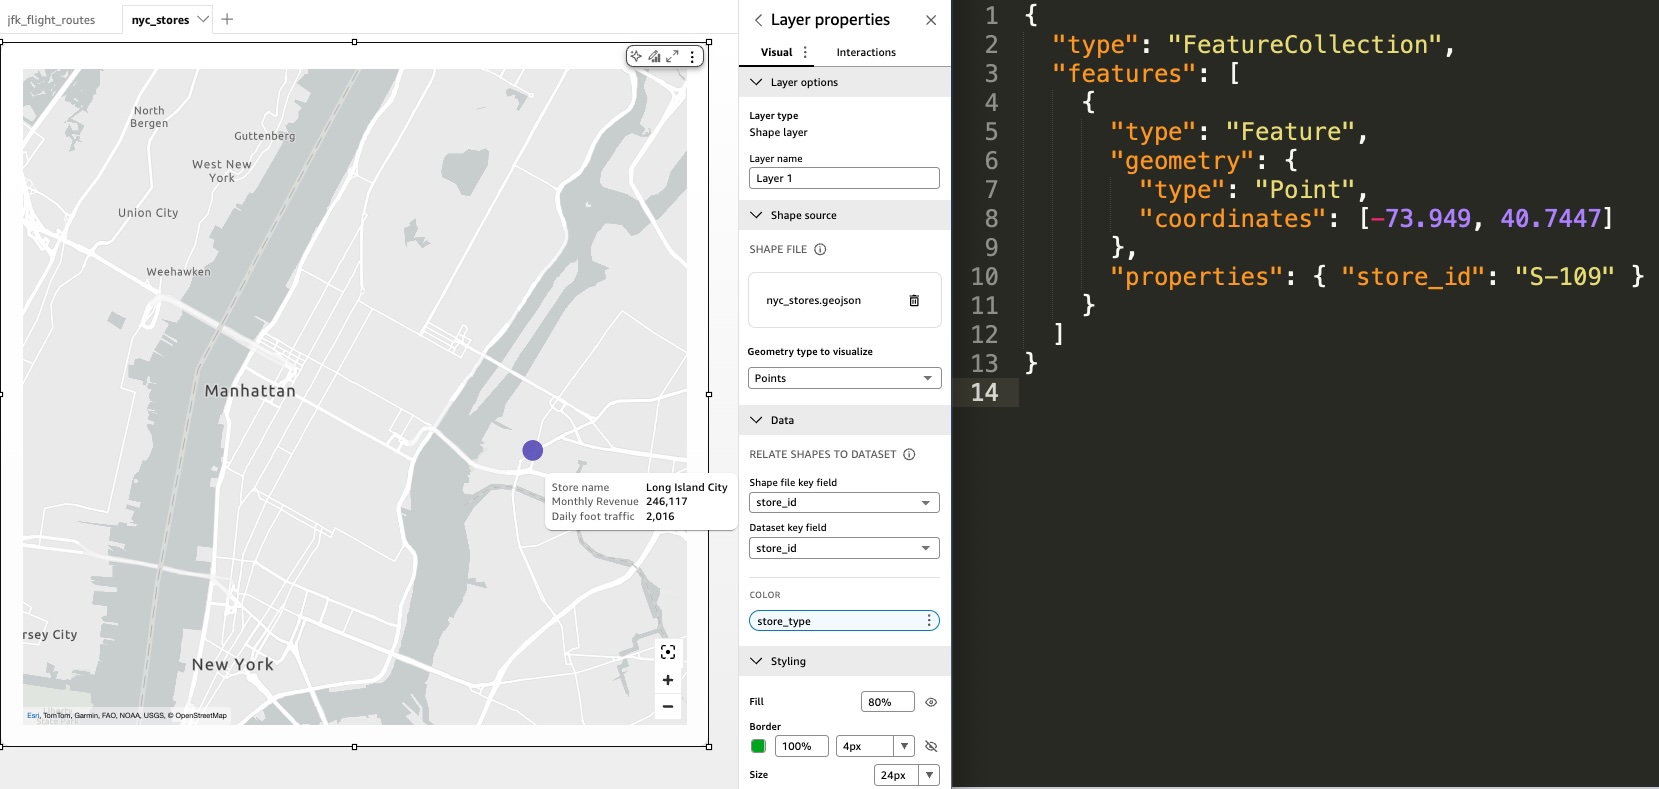
In contrast, layer map visual points utilize a static GeoJSON file coupled with explicit coordinate declarations. They do not perform automatic geocoding and require manual file updates or programmatic API calls to reflect structural changes in physical locations. However, this trade-off grants administrators unmatched control over the visual presentation and viewport boundaries. Layer maps allow organizations to lock geographic views, disable unwanted panning and zooming, and enforce consistent visual perspectives across enterprise dashboards. This ensures that regional managers viewing metro-area performance cannot inadvertently distort the spatial context by zooming out to national or global perspectives.
Advanced Configuration and Programmatic Integration
For enterprise deployments requiring granular control, Amazon QuickSight offers advanced configuration options accessible via its software development kits and APIs. Administrators can define precise viewport coordinates and bounding boxes by modifying the MapState property within the visual’s ChartConfiguration block. By tailoring the aspect ratio of these bounding boxes to match the exact dimensions of the dashboard visual container, organizations can eliminate whitespace and present tightly focused geographic analyses.
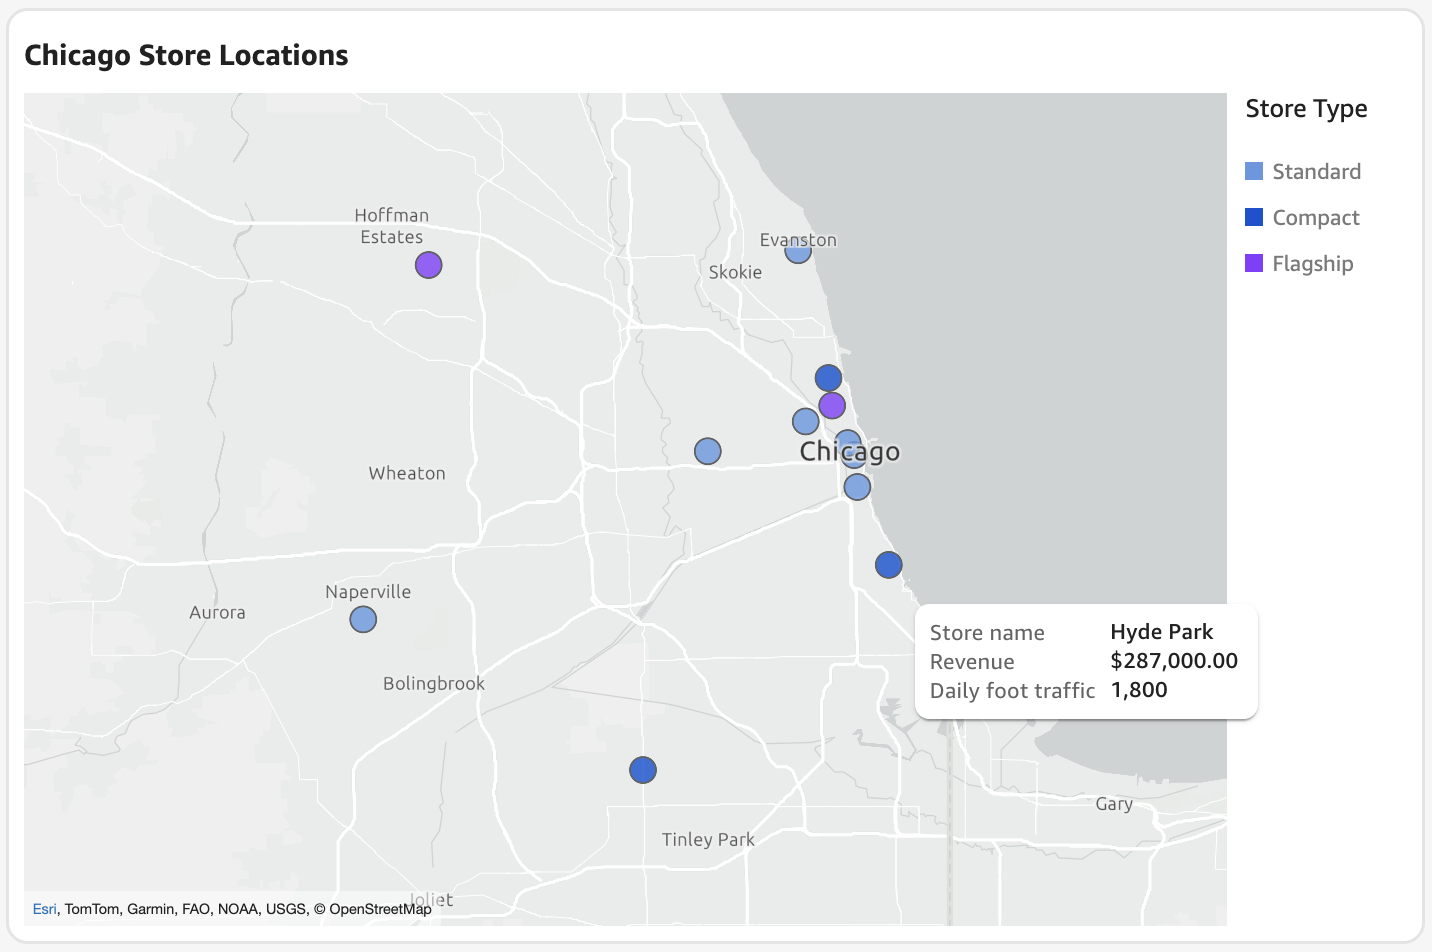
Furthermore, complex visualization requirements can be met by layering multiple independent visual elements within a free-form dashboard layout. By stacking up to five layer map visuals on a single sheet, data architects can combine diverse geometries—such as plotting customer location points over regional polygon boundaries, or superimposing scheduled delivery stops directly onto planned LineString transit routes.
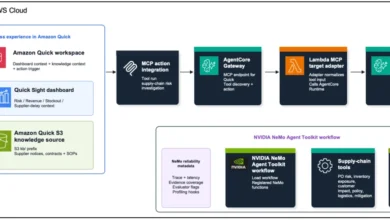
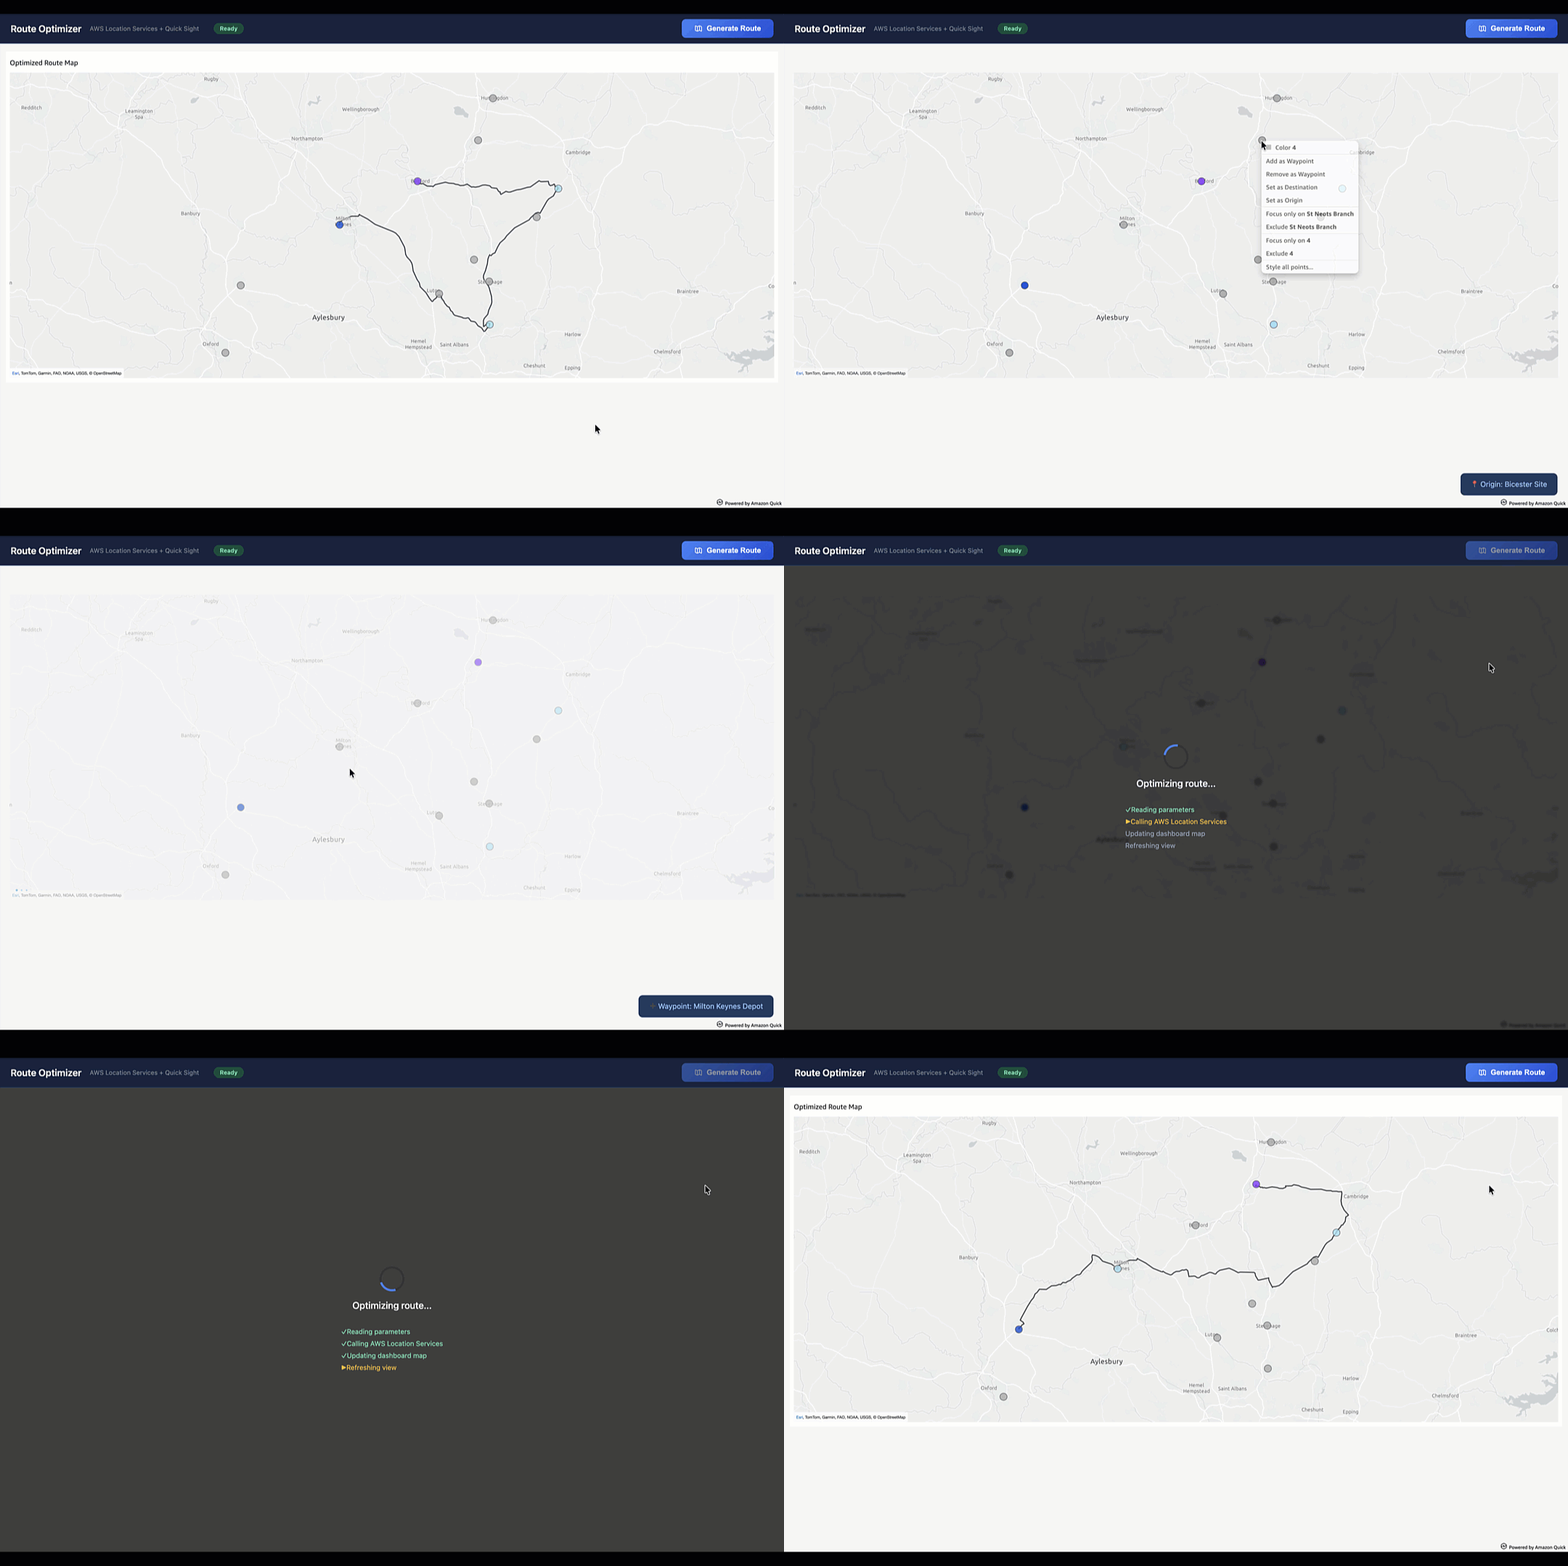
To maintain synchronization between rapidly evolving operational environments and static GeoJSON geometries, enterprises increasingly rely on automated architectures utilizing Amazon Simple Storage Service (Amazon S3) and QuickSight APIs. Under this operational model, backend applications programmatically generate updated GeoJSON files—such as newly optimized daily delivery paths—and store them in an S3 bucket. Subsequent API calls trigger dashboard updates, ensuring that embedded analytics environments continuously reflect the latest physical network changes without requiring manual intervention from data analysts.
Industry Implications and Future Outlook

The introduction of Point and LineString geometry support within Amazon QuickSight underscores a broader market trend toward unified, context-rich analytics platforms. As organizations collect unprecedented volumes of location-aware telemetry, the ability to synthesize spatial geometry with relational business metrics becomes a core competitive advantage.
Enterprise software strategists emphasize that the democratization of advanced geospatial tooling reduces reliance on standalone GIS software, allowing business analysts to build sophisticated, interactive spatial models directly within their standard BI workflows. As AWS continues to refine its integrated suite of AI-driven business insights, research automation, and embedded analytics, the boundaries between traditional data tabulation and spatial intelligence will continue to dissolve, empowering organizations to make faster, geographically informed decisions while maintaining rigorous data security and access governance.