Mastering Data Storytelling: How to Transform Complex Workforce Metrics into Actionable Leadership Insights

Communicating organizational challenges to executive leadership requires striking a delicate balance between comprehensive transparency and cognitive simplicity. When human resources departments or operational teams identify an impending staffing shortfall, the immediate temptation is to consolidate every metric, forecast, and historical comparison into a single, dense visualization. However, recent insights from corporate data visualization workshops highlight a common pitfall: when every detail is crammed into one chart, the core narrative becomes buried beneath layers of visual noise.
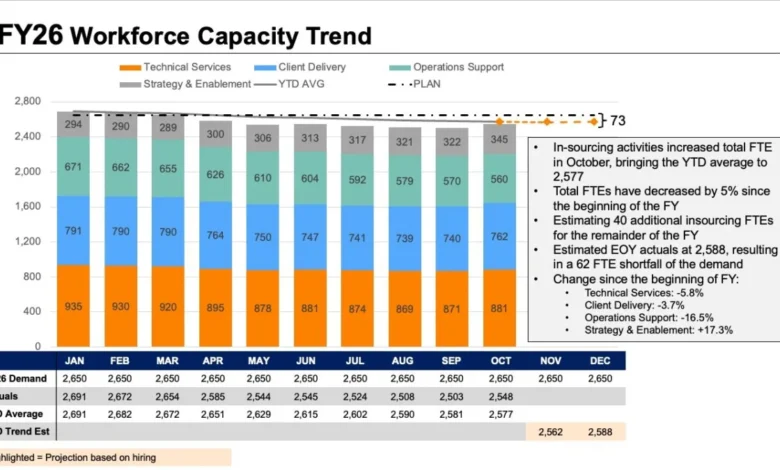
This challenge was recently highlighted during a customized client workshop hosted by Storytelling with Data, where a corporate team struggled to present a multifaceted workforce issue. The organization needed to convey three critical points to its executive committee: that full-time equivalent (FTE) staffing levels were projected to fall significantly below annual targets, that a sharp decline in operations support roles was the primary driver of this shortfall, and that leadership needed to immediately deliberate on strategic countermeasures.
While all the necessary data points were present in the initial briefing materials, the method of delivery obscured the message, forcing executives to decipher a labyrinth of conflicting visual signals rather than focusing on strategic decision-making.

The Anatomy of a Visual Overload
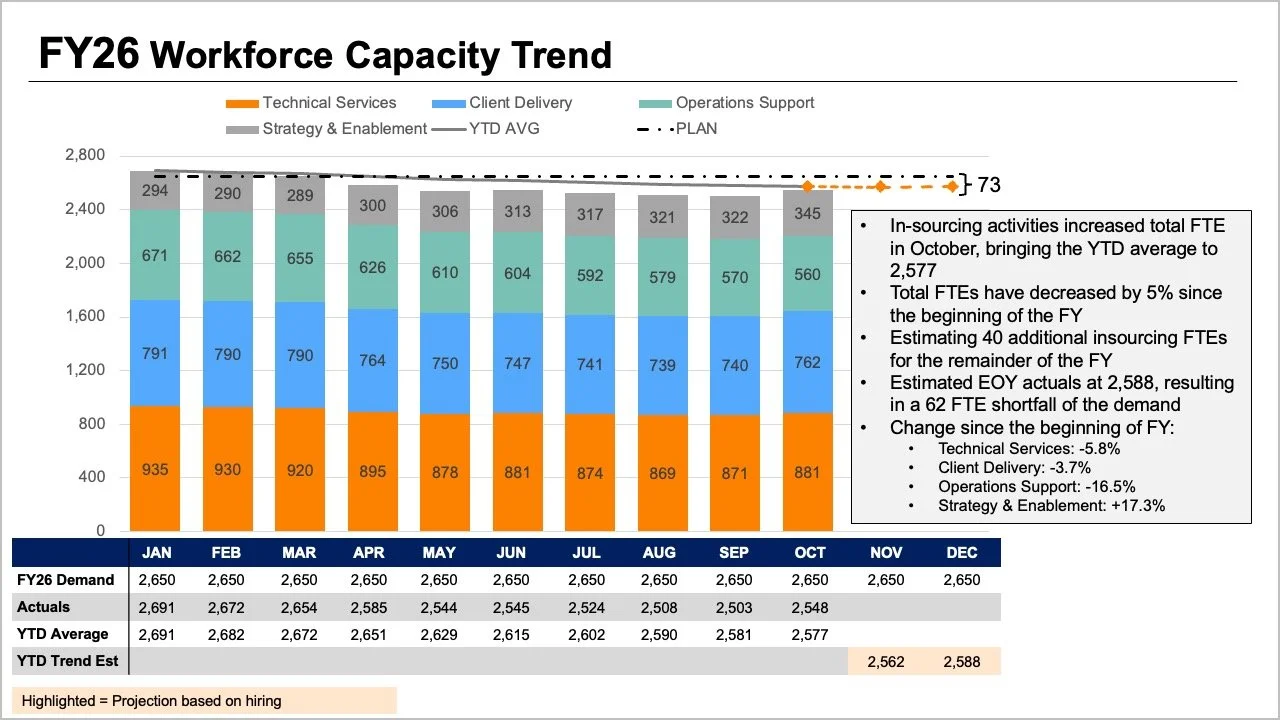
The original reporting slide presented to leadership attempted to answer too many questions simultaneously. It featured stacked bar charts displaying role breakdowns, trend lines tracking overall figures, and a comprehensive data table illustrating performance metrics. Furthermore, the visualization integrated multiple comparative layers, including annual plans, actual year-to-date performance averages, and future workforce projections.
While each individual element addressed a valid analytical inquiry, combining them into a single graphic created cognitive overload. Executives attempting to interpret the slide were forced to track the tops of stacked bars, analyze cross-cutting trend lines, and parse dense tabular data concurrently. This lack of visual hierarchy made it difficult to answer any single question with absolute clarity.
Data visualization experts emphasize that effective communication begins by identifying the core questions decision-makers need answered. In the context of workforce planning, executives typically require clear, unambiguous answers to two fundamental inquiries: First, what is the expected scale of the operational staffing shortfall? Second, what do granular staffing metrics reveal about where and why these shifts are occurring?
Addressing these distinct questions requires abandoning the impulse to construct a singular "catch-all" chart in favor of a segmented, multi-view approach that breaks complex information down into digestible, targeted components.
Utilizing Line Charts to Clarify Overall Trends
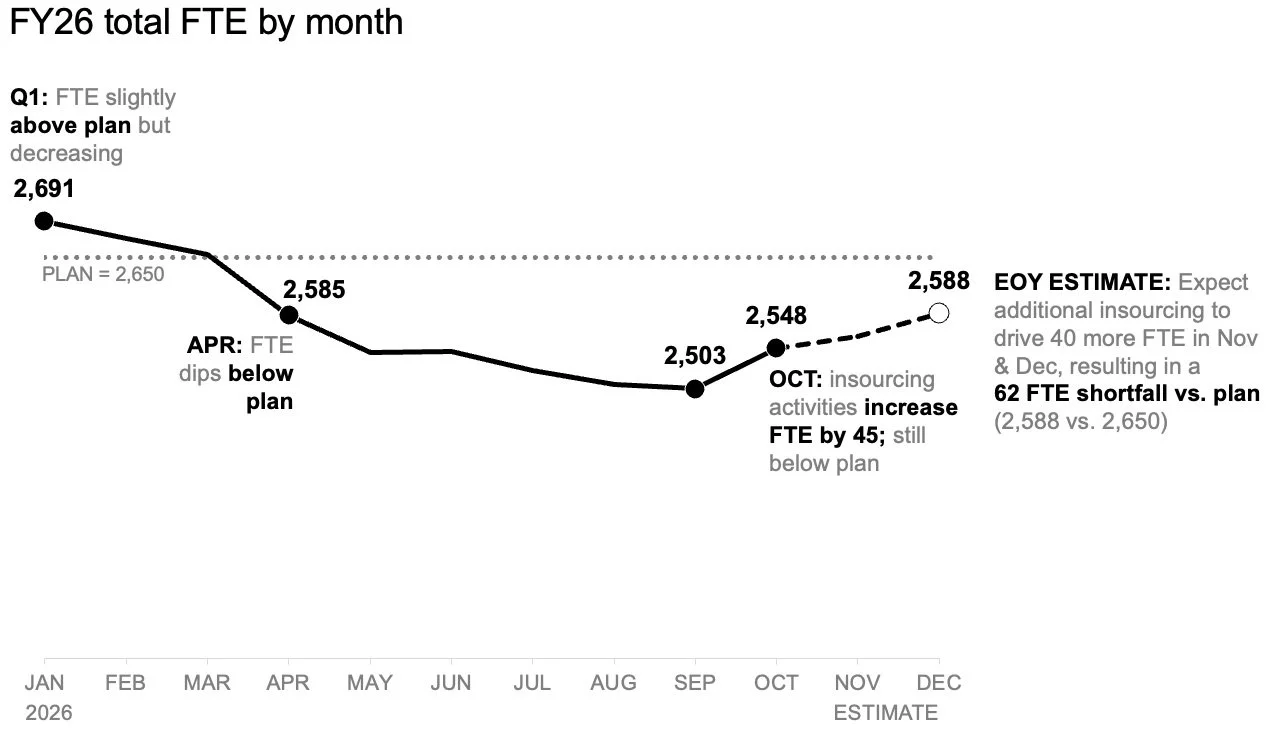
To address the first core question—the magnitude of the anticipated staffing shortfall—analysts recommend separating the macro-level trend from micro-level role variations. By utilizing a standalone line chart, organizations can map historical workforce trajectories against the baseline plan established at the beginning of the fiscal year, while simultaneously projecting future headcount trajectories.
This isolated view provides several distinct advantages. It eliminates the visual clutter associated with role-mix breakdowns and dense data tables, allowing the audience to concentrate exclusively on the trajectory of the overall workforce. Furthermore, a clean line chart provides sufficient negative space for strategic annotations. Key inflection points, such as the exact month divergence began or the projected peak of the deficit, can be highlighted with text callouts.
By removing competing variables, the audience can instantly grasp the severity of the expected gap to plan, setting the stage for a productive executive discussion regarding resource allocation and operational capacity.
Unpacking Role-Level Shifts with Slopegraphs
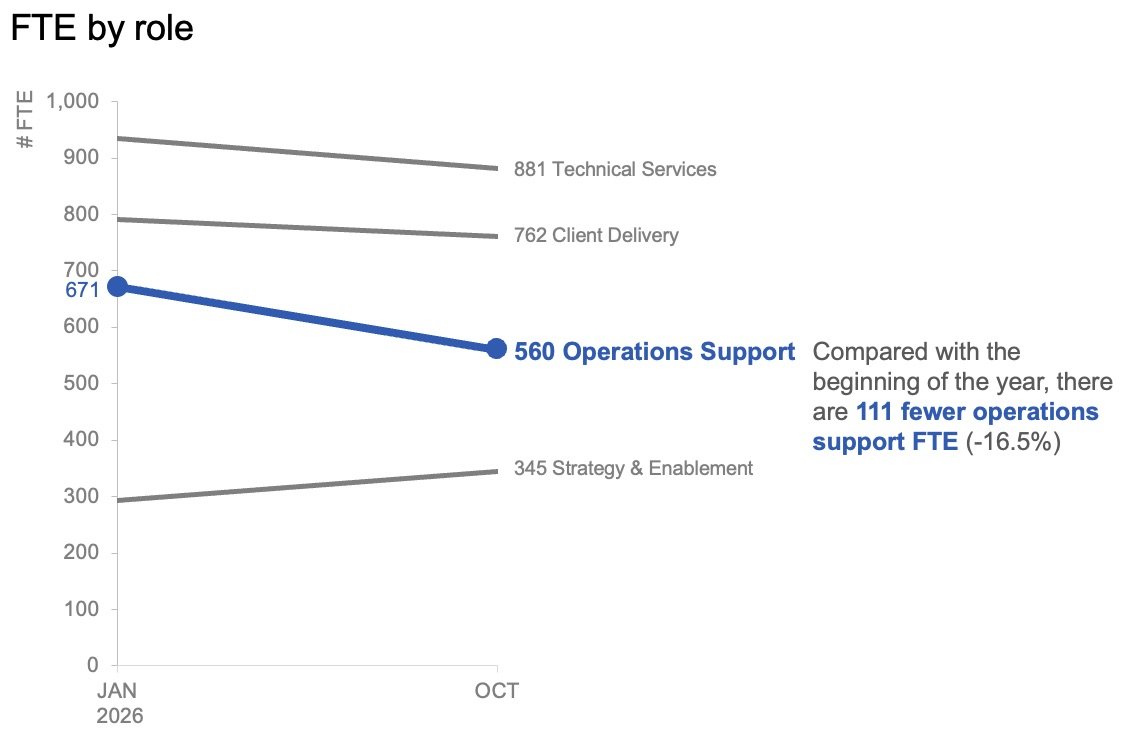
Once the macro-level shortfall has been established, leadership must understand the underlying composition of the workforce change. Month-to-month fluctuations, while relevant for operational scheduling, often obscure broader structural trends over longer horizons. To analyze these shifts effectively, data strategists suggest employing a slopegraph to examine role-level changes between the start of the fiscal year and the most recent reporting period.
A slopegraph simplifies comparative analysis by focusing strictly on the initial baseline and the current state, connecting the two data points with sloped lines for each job category. This format instantly highlights which roles have experienced the most dramatic expansion or contraction.
In the case of the workshop client, the slopegraph revealed that while professional and technical roles remained relatively stable, operations support positions had suffered a precipitous drop. By applying strategic color accents and minimal text labels exclusively to the operations support category, the presenter successfully directed executive attention to the root cause of the wider organizational deficit without requiring the audience to mentally parse a complex matrix of numbers.
Tailoring the Delivery: Static Reports Versus Live Presentations
The effectiveness of data visualization is heavily influenced by the delivery mechanism. When designing reports intended for asynchronous review—such as executive briefing decks distributed via email or internal portals without a live presenter—both analytical views can be placed cohesively on a single page or slide.
In this layout-sharing scenario, a strong, action-oriented slide title explicitly states the expected workforce shortfall. Supporting text provides necessary context by pointing directly to the decline in operations support roles and framing the data as a catalyst for executive action. The accompanying line chart and slopegraph provide the empirical evidence below, functioning harmoniously without competing for visual prominence.
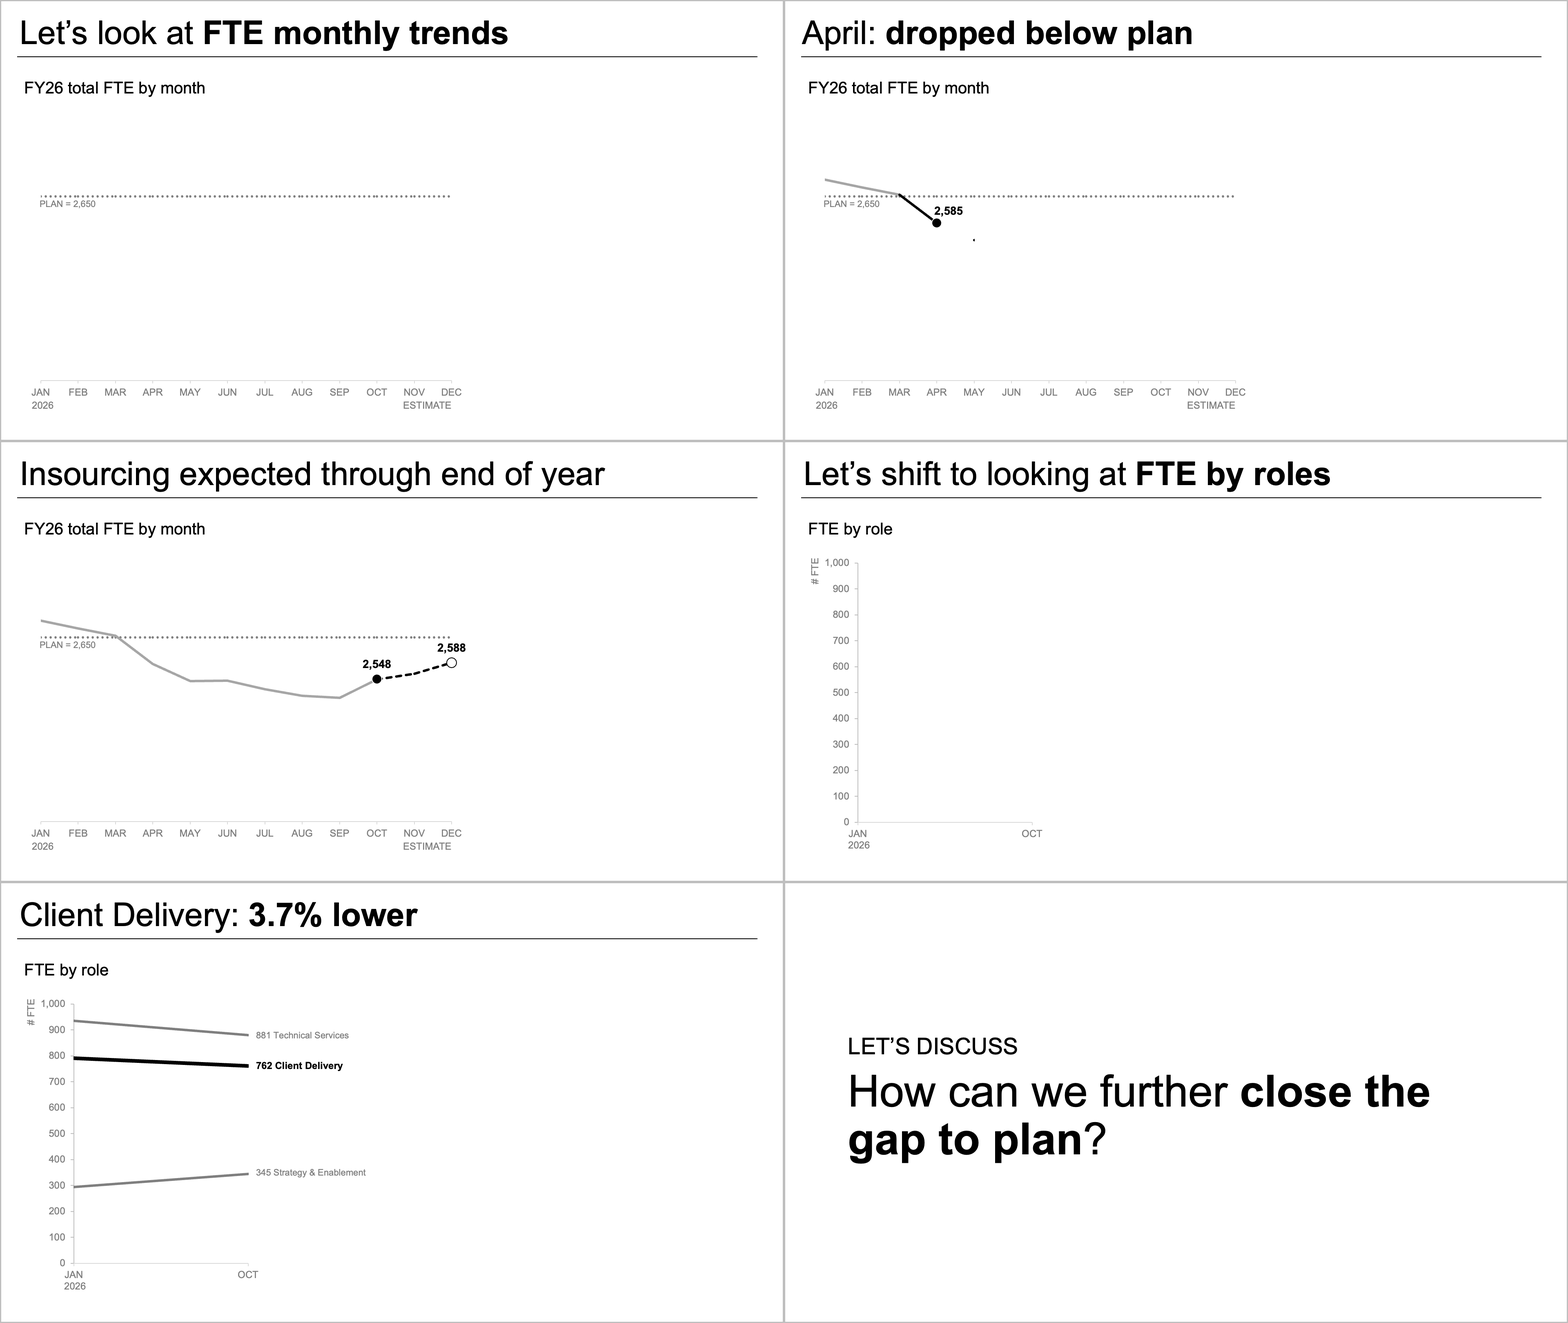
Conversely, live presentations demand a completely different rhetorical strategy. Subject matter experts presenting to a live audience should avoid exposing viewers to the entire analytical framework simultaneously. Instead, effective presenters utilize sequential disclosure: walking the board through the overall macro-level forecast first, pausing to establish the baseline shortfall, and then revealing the role-level slopegraph data piecewise.
This phased approach mirrors the natural cognitive process of human comprehension. By pacing the delivery, presenters ensure the audience fully absorbs one critical insight before introducing supporting evidence, ultimately steering the room toward a focused, productive discussion on remediation strategies.
Broader Implications for Corporate Governance and Data Literacy
The lessons derived from this workforce planning workshop extend far beyond human resources metrics, offering a broader blueprint for corporate communication and data governance. In an era defined by data abundance, organizations frequently mistake the volume of information presented for the quality of insight delivered.
When operational leaders present dense, unrefined dashboards to executive boards or regulatory bodies, decision-making processes slow down. Misinterpretations arise not from a lack of analytical rigor, but from poor visual translation. Streamlining data narratives into targeted, question-specific graphics reduces cognitive fatigue, minimizes the risk of strategic miscalculation, and accelerates institutional responsiveness.
Furthermore, fostering a culture of intentional data storytelling empowers mid-level managers to bridge the gap between technical analysts and executive decision-makers. As companies increasingly rely on predictive analytics to navigate labor market volatility, supply chain disruptions, and economic uncertainty, the ability to translate complex statistical models into clear, human-centric narratives will remain a critical competency.
Ultimately, data visualization is not merely an aesthetic exercise; it is an essential leadership tool. By separating macro trends from micro details, utilizing appropriate chart types like line graphs and slopegraphs, and structuring information for deliberate consumption, organizations can ensure their data speaks with clarity, conviction, and impact.
Related posts: