Mastering Data Storytelling Design: How Artificial Intelligence is Transforming Presentation Architecture


The modern corporate landscape is flooded with data, yet organizations frequently struggle to translate raw metrics into compelling, actionable narratives. As data visualization and presentation standards evolve, professionals face mounting pressure to produce clean, highly effective slides that capture audience attention without inducing cognitive overload. Addressing this persistent professional challenge, the ongoing Storytelling with Data (SWD) + AI series provides a strategic framework for leveraging generative artificial intelligence as a practical thought partner across every phase of the data storytelling workflow. Building upon foundational installments dedicated to context, narrative crafting, and visual selection, the latest guidance focuses on the intricate mechanics of slide design and graph refinement using AI integrated directly into desktop presentation software.
The Design Gap: Moving From Good Enough to Effective Communication
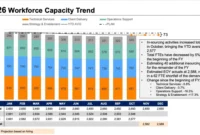
A significant portion of presentation preparation time is typically consumed by the design phase, where the boundary between mediocre slides and genuinely impactful communication becomes apparent. Automated charting applications and initial AI-generated drafts routinely produce visualizations that require substantial human curation before they are ready for presentation. Raw graphs frequently lack takeaway titles, forcing audiences to guess at underlying insights, while cluttered layouts compel viewers to expend unnecessary mental energy deciphering dense tables and charts.
Industry experts emphasize that bridging this gap separates standard informative reporting from transformative communication that motivates stakeholders to act. Historically, perfecting these elements required hours of manual formatting, alignment adjustments, and iterative redrafting. However, modern integration of artificial intelligence directly into productivity suites such as Microsoft PowerPoint—utilizing tools like Copilot alongside advanced language models like Claude and ChatGPT—allows professionals to generate editable slide layouts in minutes rather than hours.
Core Principles of Effective Visual Design
Achieving structural clarity in presentation design relies upon four fundamental principles: decluttering, alignment, focus, and deliberate language utilization. When applied systematically, these guidelines eliminate visual noise and direct audience attention toward critical takeaways.
Decluttering to Reduce Cognitive Load
Every element introduced onto a slide or graph contributes to cognitive load—the mental bandwidth expended by an audience while processing visual stimuli. Information designers stress that minimalism should not be pursued for aesthetic reasons alone; rather, extraneous elements must be systematically removed so that essential data stands out. In practical terms, this requires eliminating heavy chart borders, distracting background gridlines, redundant axis labels, and default styling features automatically applied by charting software.
Achieving Visual Order Through Alignment
Misaligned visual elements—such as text frames starting at inconsistent coordinates, graphs floating randomly across a canvas, or titles failing to properly anchor subsequent content—introduce subconscious friction for the viewer. Consistent horizontal and vertical alignment establishes a reliable visual structure, enabling audiences to navigate complex data presentations intuitively.
Directing Attention via Contrast and Hierarchy
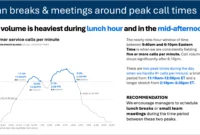
Even pristine, uncluttered visuals can leave viewers uncertain about which data points carry the greatest weight. Presenters must actively guide audience focus by leveraging selective color usage, differential sizing, and strategic positioning. When a single data point is highlighted against a neutral color palette, or when visual hierarchy emphasizes key metrics through scale, the correct takeaway becomes immediately obvious without requiring verbal directives.
Utilizing Intentional Language
Data visualizations require precise textual accompaniment to contextualize raw numbers. Every individual graph necessitates a descriptive title outlining the underlying data, while every presentation slide requires a takeaway title—a complete sentence addressing the implied question of operational significance. Supplementary annotations must be applied sparingly to highlight specific inflection points, ensuring that every word earns its place by directly serving the audience’s informational needs.
Integrating AI into the Presentation Workflow
A critical distinction in modern productivity workflows is the shift from evaluating static image prototypes to generating fully editable native slide elements. By utilizing AI tools embedded directly within presentation environments, users can input raw datasets alongside contextual parameters to yield structured, modulatory layouts.
To maximize the efficacy of these tools, data storytelling frameworks recommend providing artificial intelligence models with specialized foundational primers—such as the comprehensive SWD + AI primer—prior to prompt execution. By grounding large language models in established design principles before generating code or slide structures, professionals report significantly higher-quality outputs that adhere to professional graphic standards.
Standardized Prompt Architecture
Effective utilization of generative design assistants requires a structured prompting methodology. Analysts are advised to supply context across specific parameters:
- Context and Source Material: Sharing draft slides, raw data tables, or descriptive requirements.
- Audience Definition: Explicitly identifying the demographic, role, and familiarity level of the intended viewers.
- Core Message: Articulating the primary takeaway or "Big Idea" in a single declarative sentence.
- Delivery Format: Specifying whether the output will function as an isolated report graphic, a virtual meeting slide, or an in-person boardroom presentation.
Industry Implications and Future Outlook
The integration of generative artificial intelligence into corporate data visualization marks a paradigm shift in enterprise communication. By automating up to ninety percent of the mechanical layout, formatting, and alignment tasks, AI empowers analysts, managers, and executives to redirect their focus toward higher-order strategic thinking, narrative refinement, and decision-making.
As organizations increasingly standardize around brand-compliant AI templates and integrated office tools, the baseline quality of business presentations is projected to rise significantly. However, human oversight remains indispensable. The final ten percent of refinement—incorporating nuanced contextual judgment, precise emotional resonance, and rigorous data validation—ensures that automated efficiency continually serves authentic human insight.