
Modern data analytics architectures have long relied on the "gold layer" of a data warehouse to serve as the definitive source of truth for business intelligence. In this model, data engineers curate, clean, and pre-aggregate datasets into standardized tables that downstream consumers—typically business analysts using SQL or dashboarding tools—can easily query. For the vast majority of stable, additive business metrics, this approach is not only sufficient but optimal. It keeps infrastructure costs low, avoids the complexity of additional specialized tooling, and ensures that business logic is codified within version-controlled models. However, a growing number of data teams are discovering that this traditional paradigm hits a functional wall when faced with complex, non-additive metrics and the need for dynamic, multi-dimensional analysis.
The Limits of Static Pre-Aggregation
The fundamental limitation of a pre-aggregated gold layer lies in its rigidity. When a data team creates a table, they must commit to a specific grain—the level of detail, such as daily, hourly, or by region. If a user needs to slice that data by an arbitrary combination of dimensions that was not anticipated during the modeling phase, they face a combinatorial explosion. If an organization wants to allow users to pivot metrics across seven distinct dimensions, they would theoretically need to generate 128 different pre-aggregated tables to ensure high-performance queries. In practice, most teams build the dozen tables they are specifically asked for, leading to a "ticket factory" cycle where every new business question requires an engineer to build a new view or aggregate table.
When teams attempt to bypass this by providing a single, wide fact table and delegating the aggregation logic to the BI tool, they encounter a more insidious problem: the risk of silent data corruption. Many critical business metrics, such as "Average Order Value" (AOV), "Conversion Rate," or "Customer Acquisition Cost," are non-additive. These metrics cannot be calculated by simply summing or averaging the sub-totals of a pre-aggregated table.
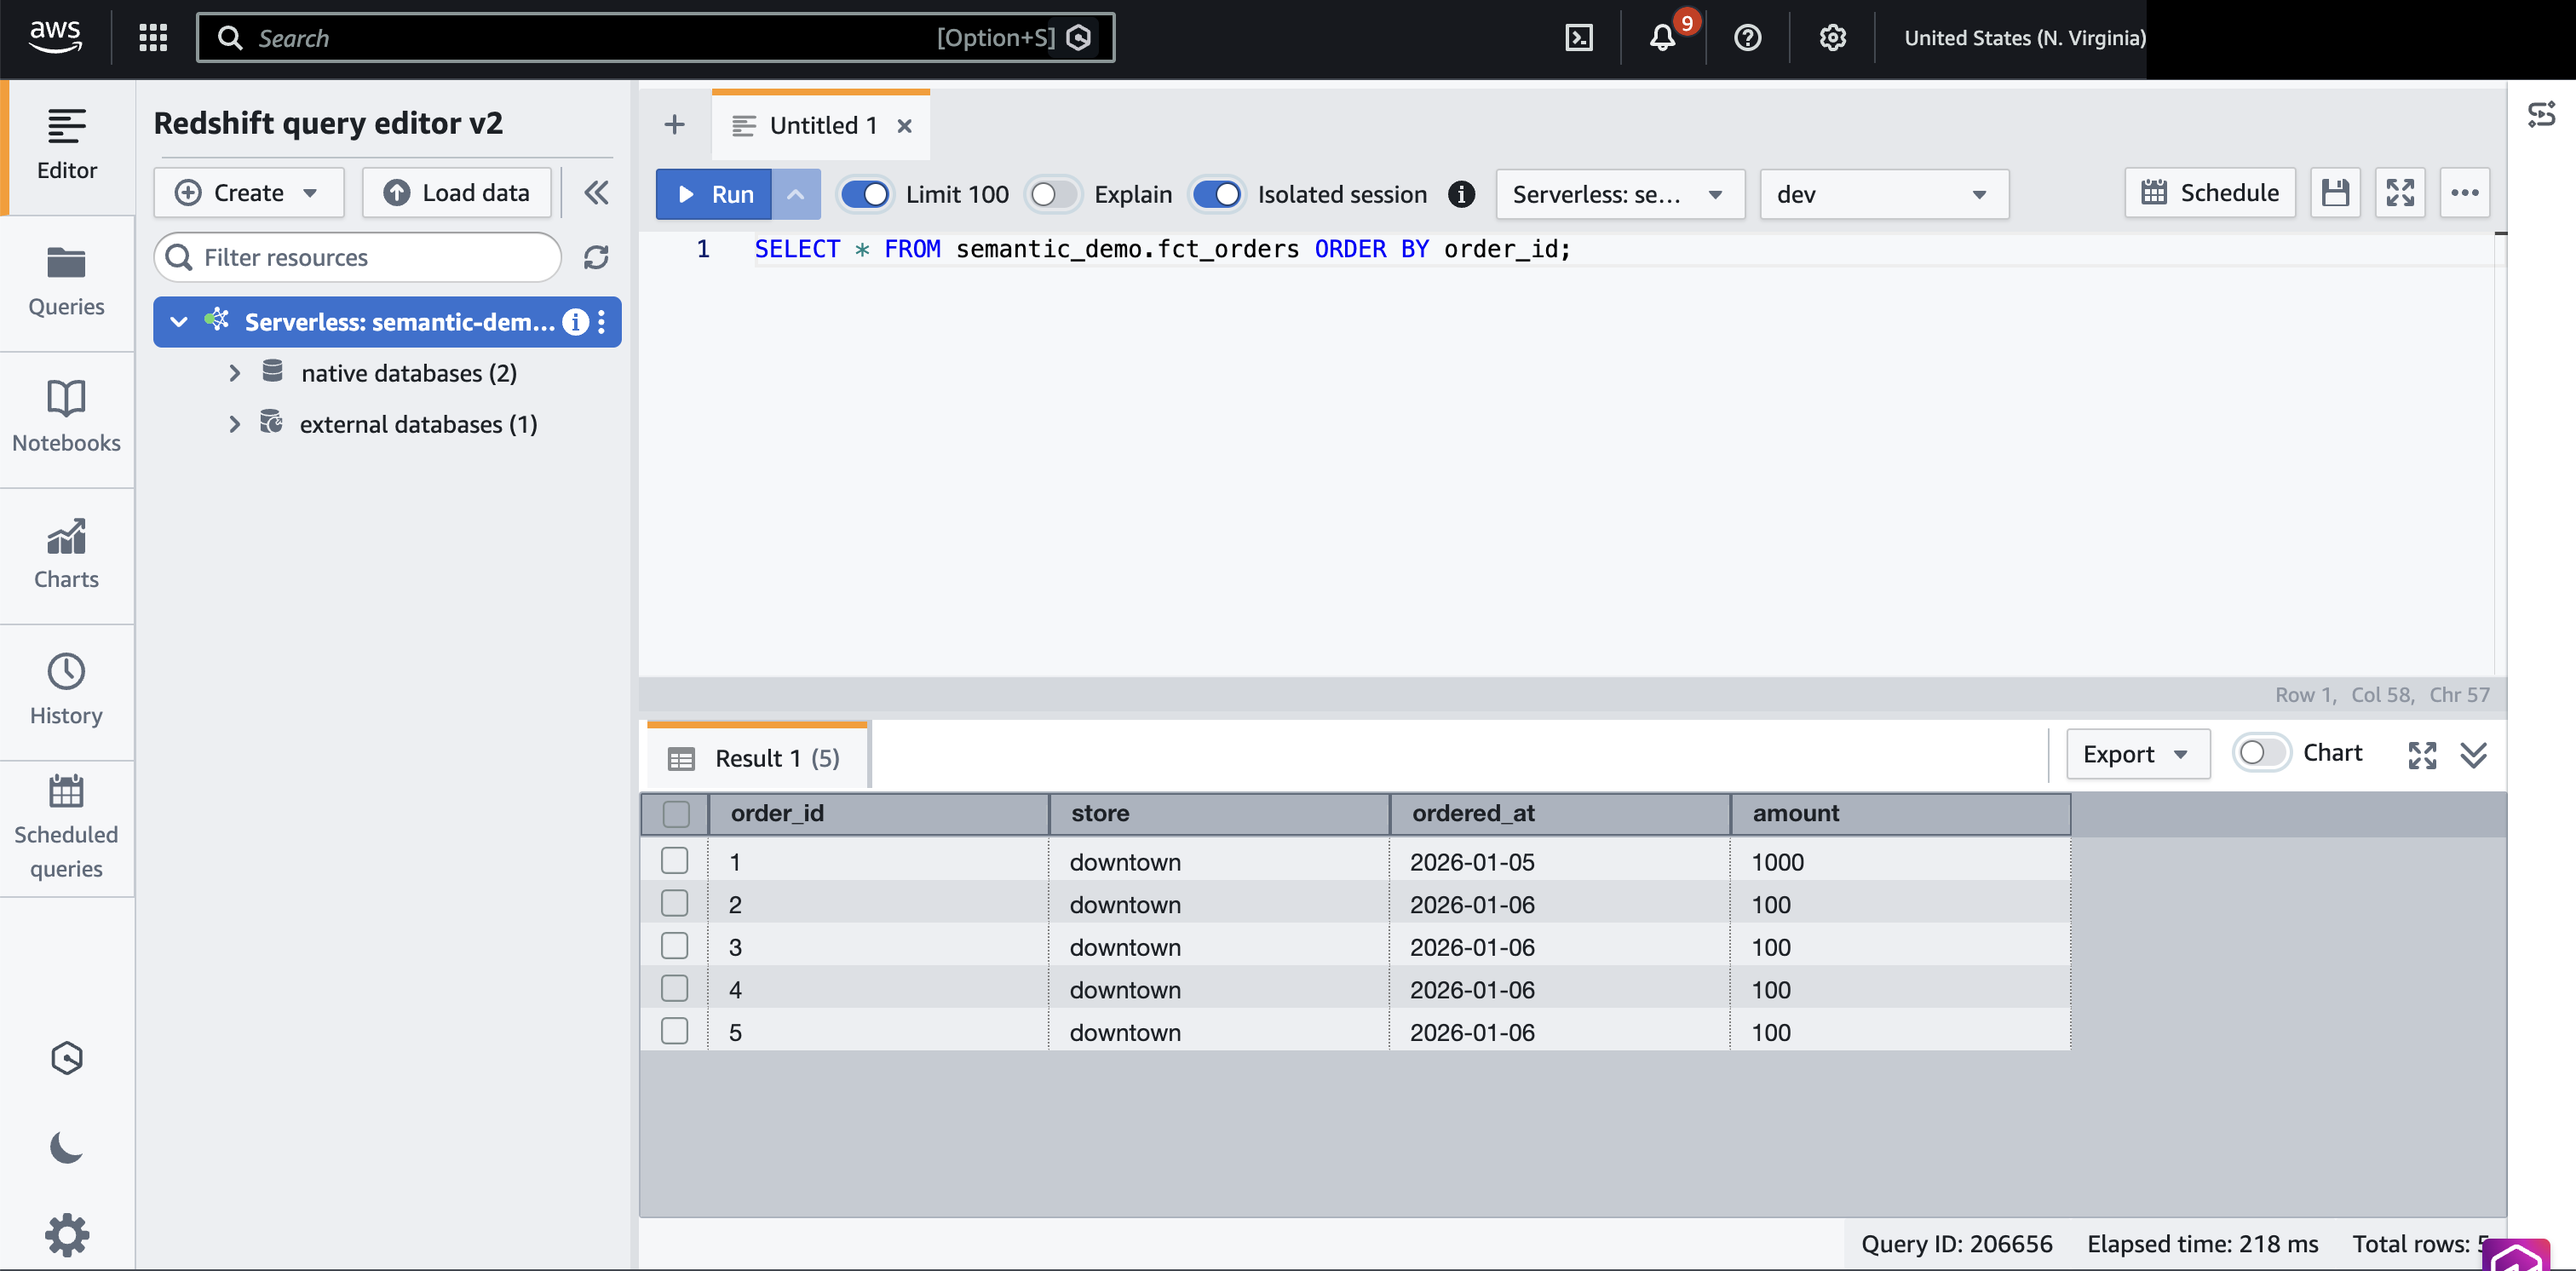
Consider a retail scenario where a store records five orders over two days. If the gold layer is aggregated to a daily grain, the system stores the total revenue and the total order count for each day. If a business analyst then requests the average order value for the entire week, a BI tool relying on that daily aggregate will calculate the average of the two daily averages. This mathematical shortcut yields a result that is nearly double the true value, yet the number remains plausible enough to avoid immediate scrutiny. This creates a significant risk for data-driven decision-making, where executives may act on figures that are mathematically sound in isolation but contextually incorrect.
The Rise of Semantic Layer Architectures
To address these challenges, the industry has shifted toward the adoption of semantic layers—a translation layer that lives between the physical storage of data and the analytical consumption layer. On the AWS ecosystem, this has historically been handled by tools like Amazon QuickSight Topics or the more recent AWS Context service, which uses knowledge graphs to define relationships within the AWS Glue Data Catalog. However, these tools often function downstream of the warehouse.
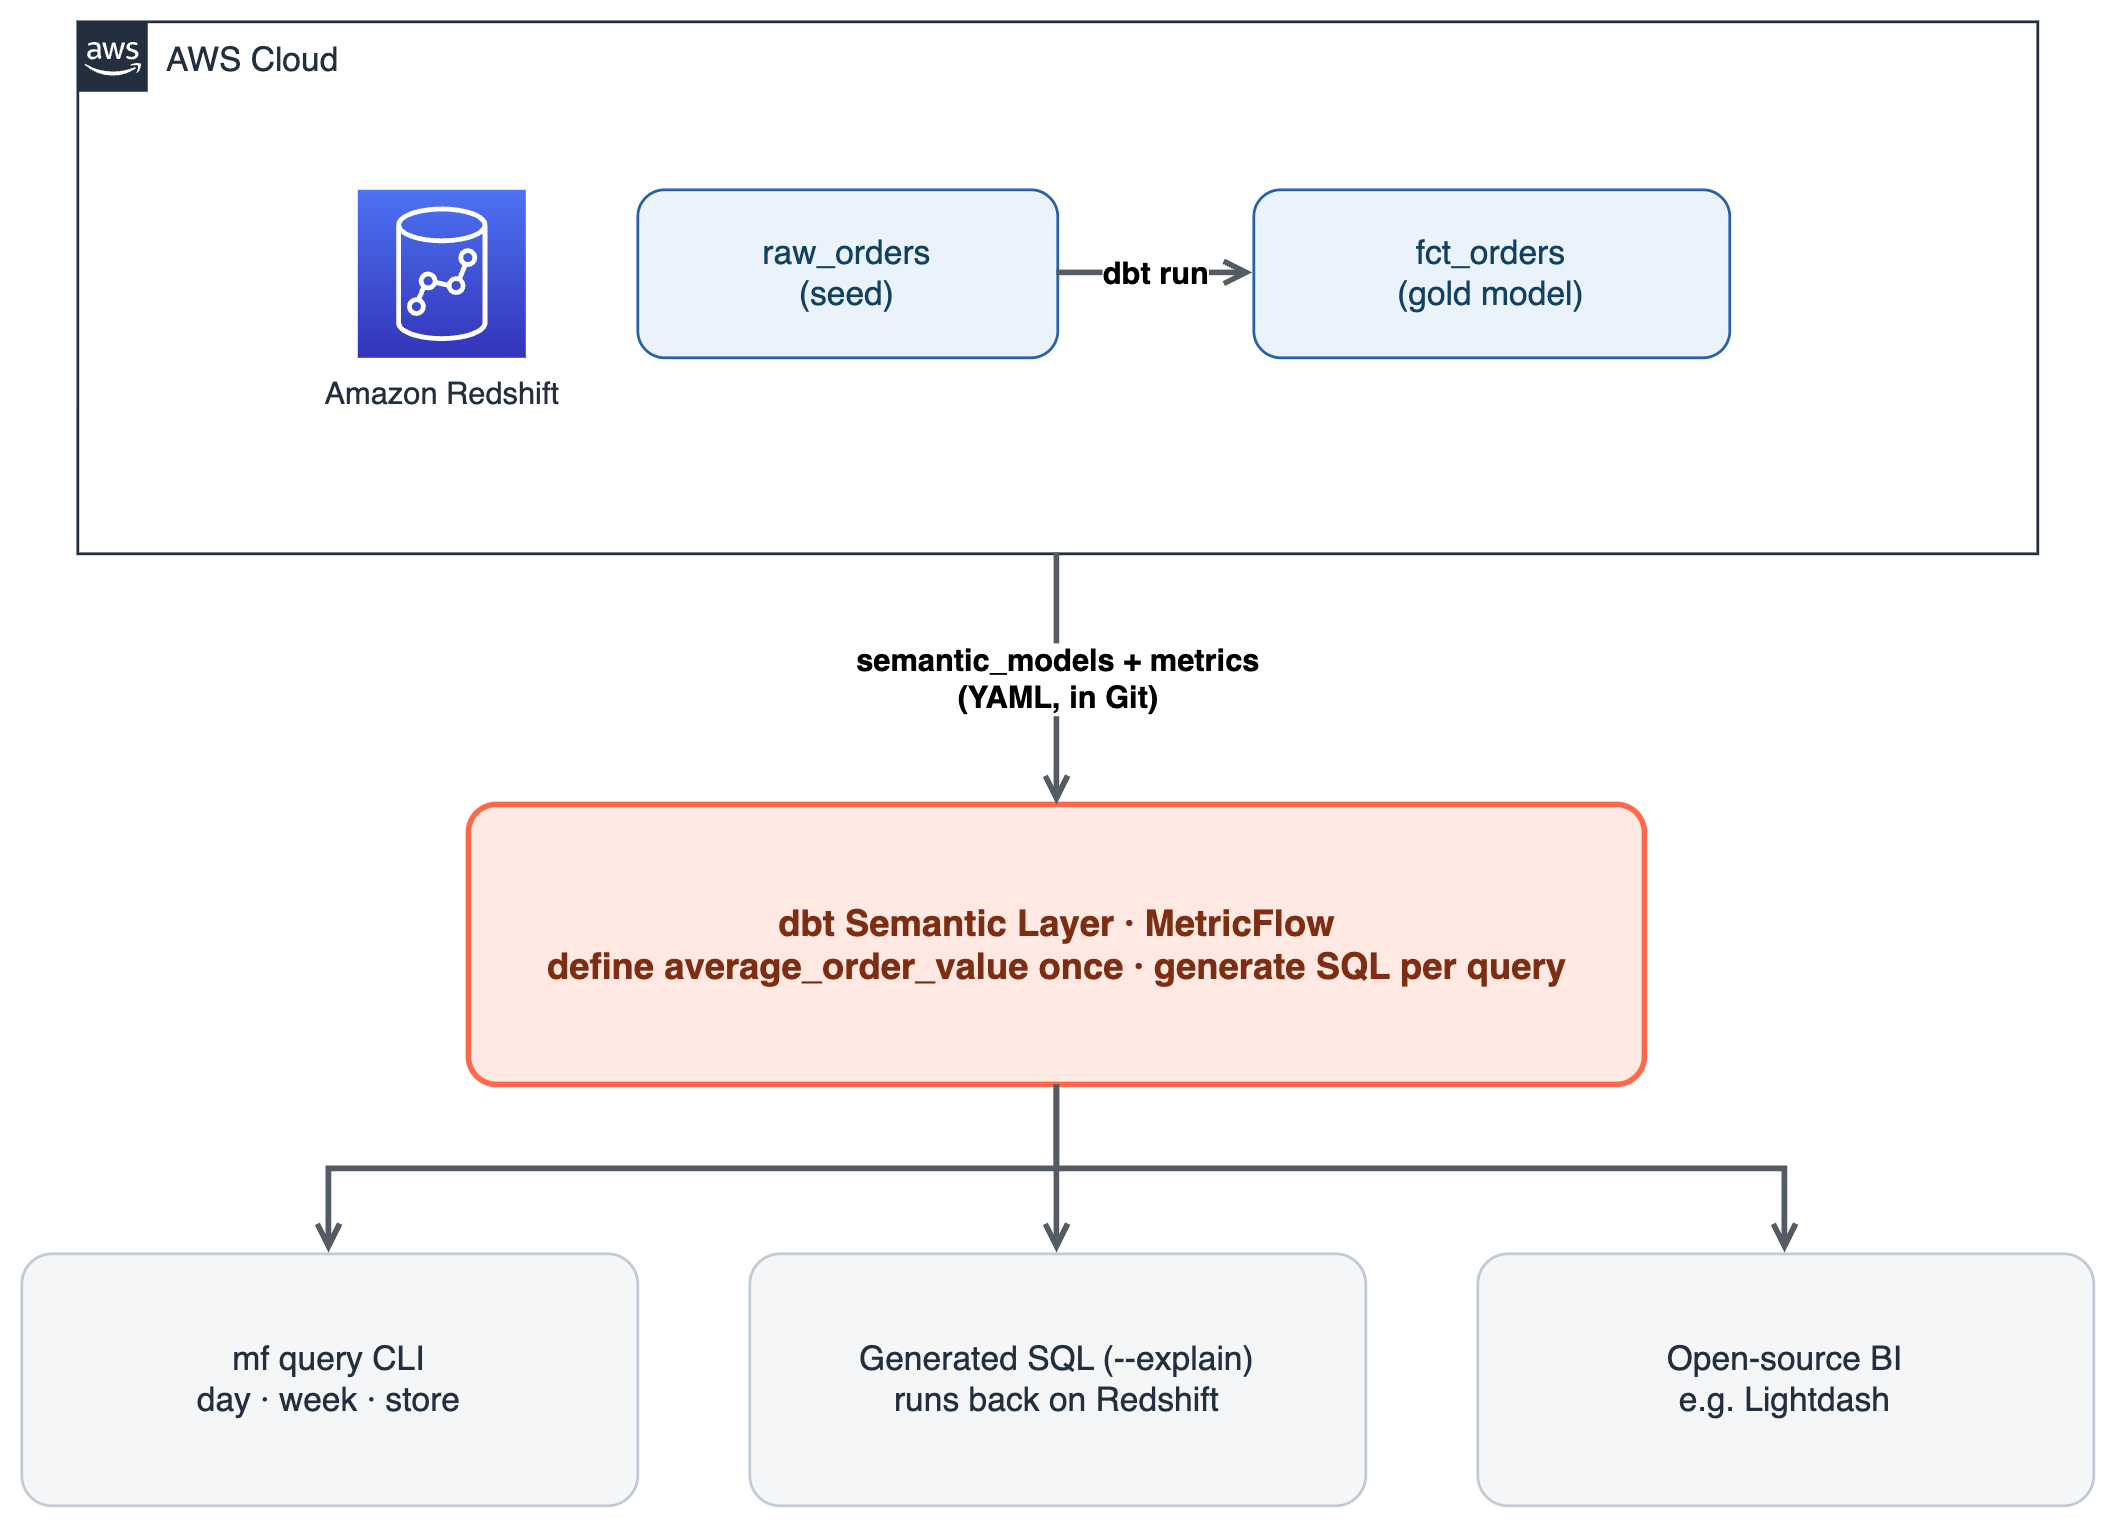
A different, increasingly popular approach involves embedding the semantic definition directly into the warehouse workflow using open-source tools such as dbt and its companion technology, MetricFlow. By defining metrics in YAML files right next to the dbt models that transform the raw data, organizations can ensure that the business logic for a metric is version-controlled, auditable, and, most importantly, calculation-aware. When a user queries a metric through this layer, the system generates the appropriate SQL on the fly, performing the calculation at the correct grain against the raw or base-level data.
Implementing the Solution on Amazon Redshift
The deployment of this architecture on Amazon Redshift involves a departure from traditional "build and load" cycles. In this setup, Amazon Redshift serves as the primary processing engine, while the dbt project defines the "entities" (the things being measured, like orders), "dimensions" (the attributes to slice by), and "measures" (the raw numerical columns).
The implementation follows a logical progression:
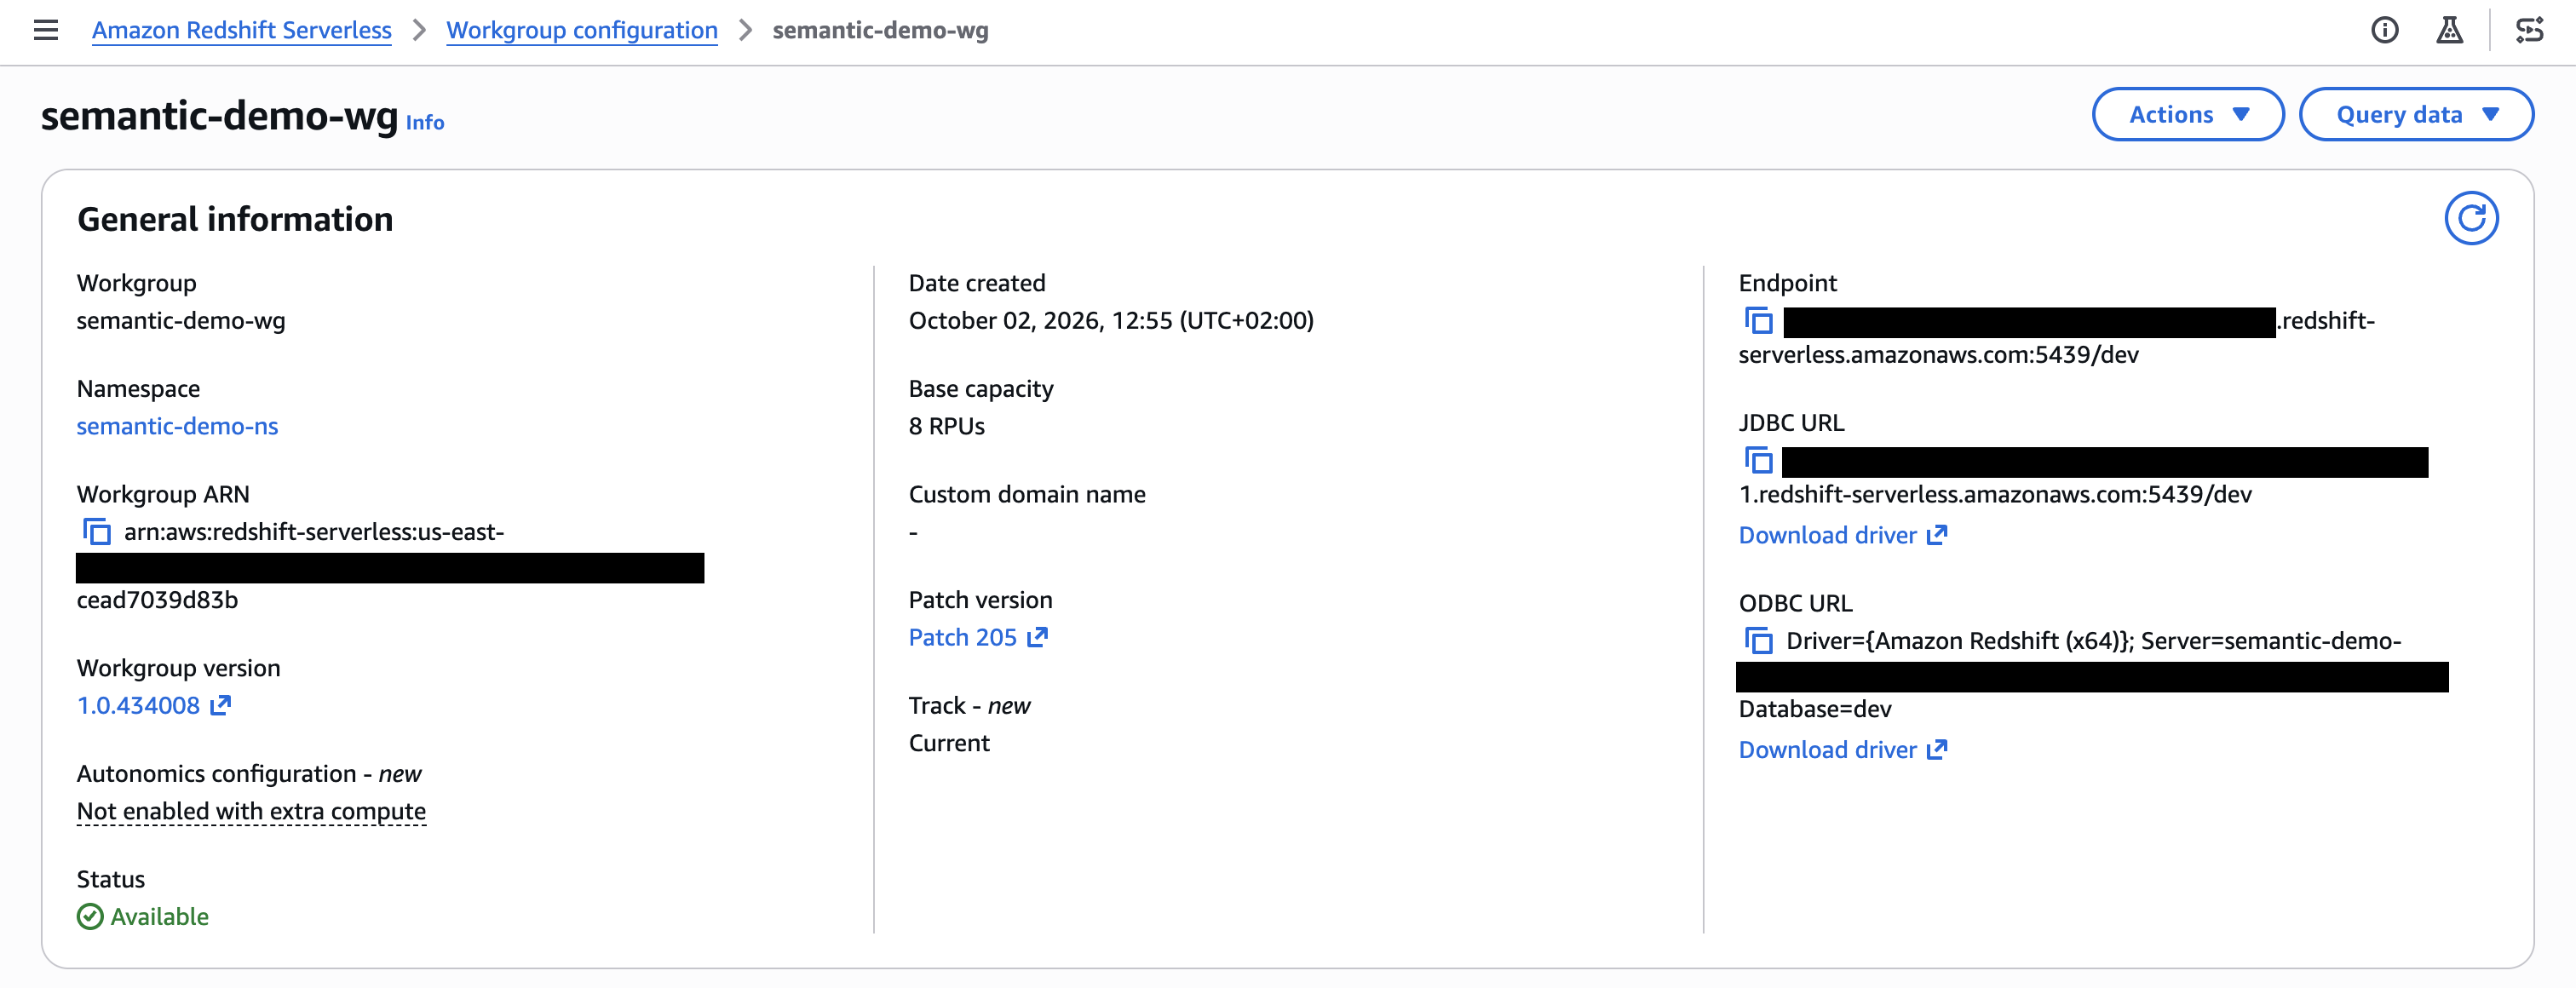
- Provisioning: Organizations utilize Redshift Serverless to manage compute resources, allowing the infrastructure to scale based on query demand.
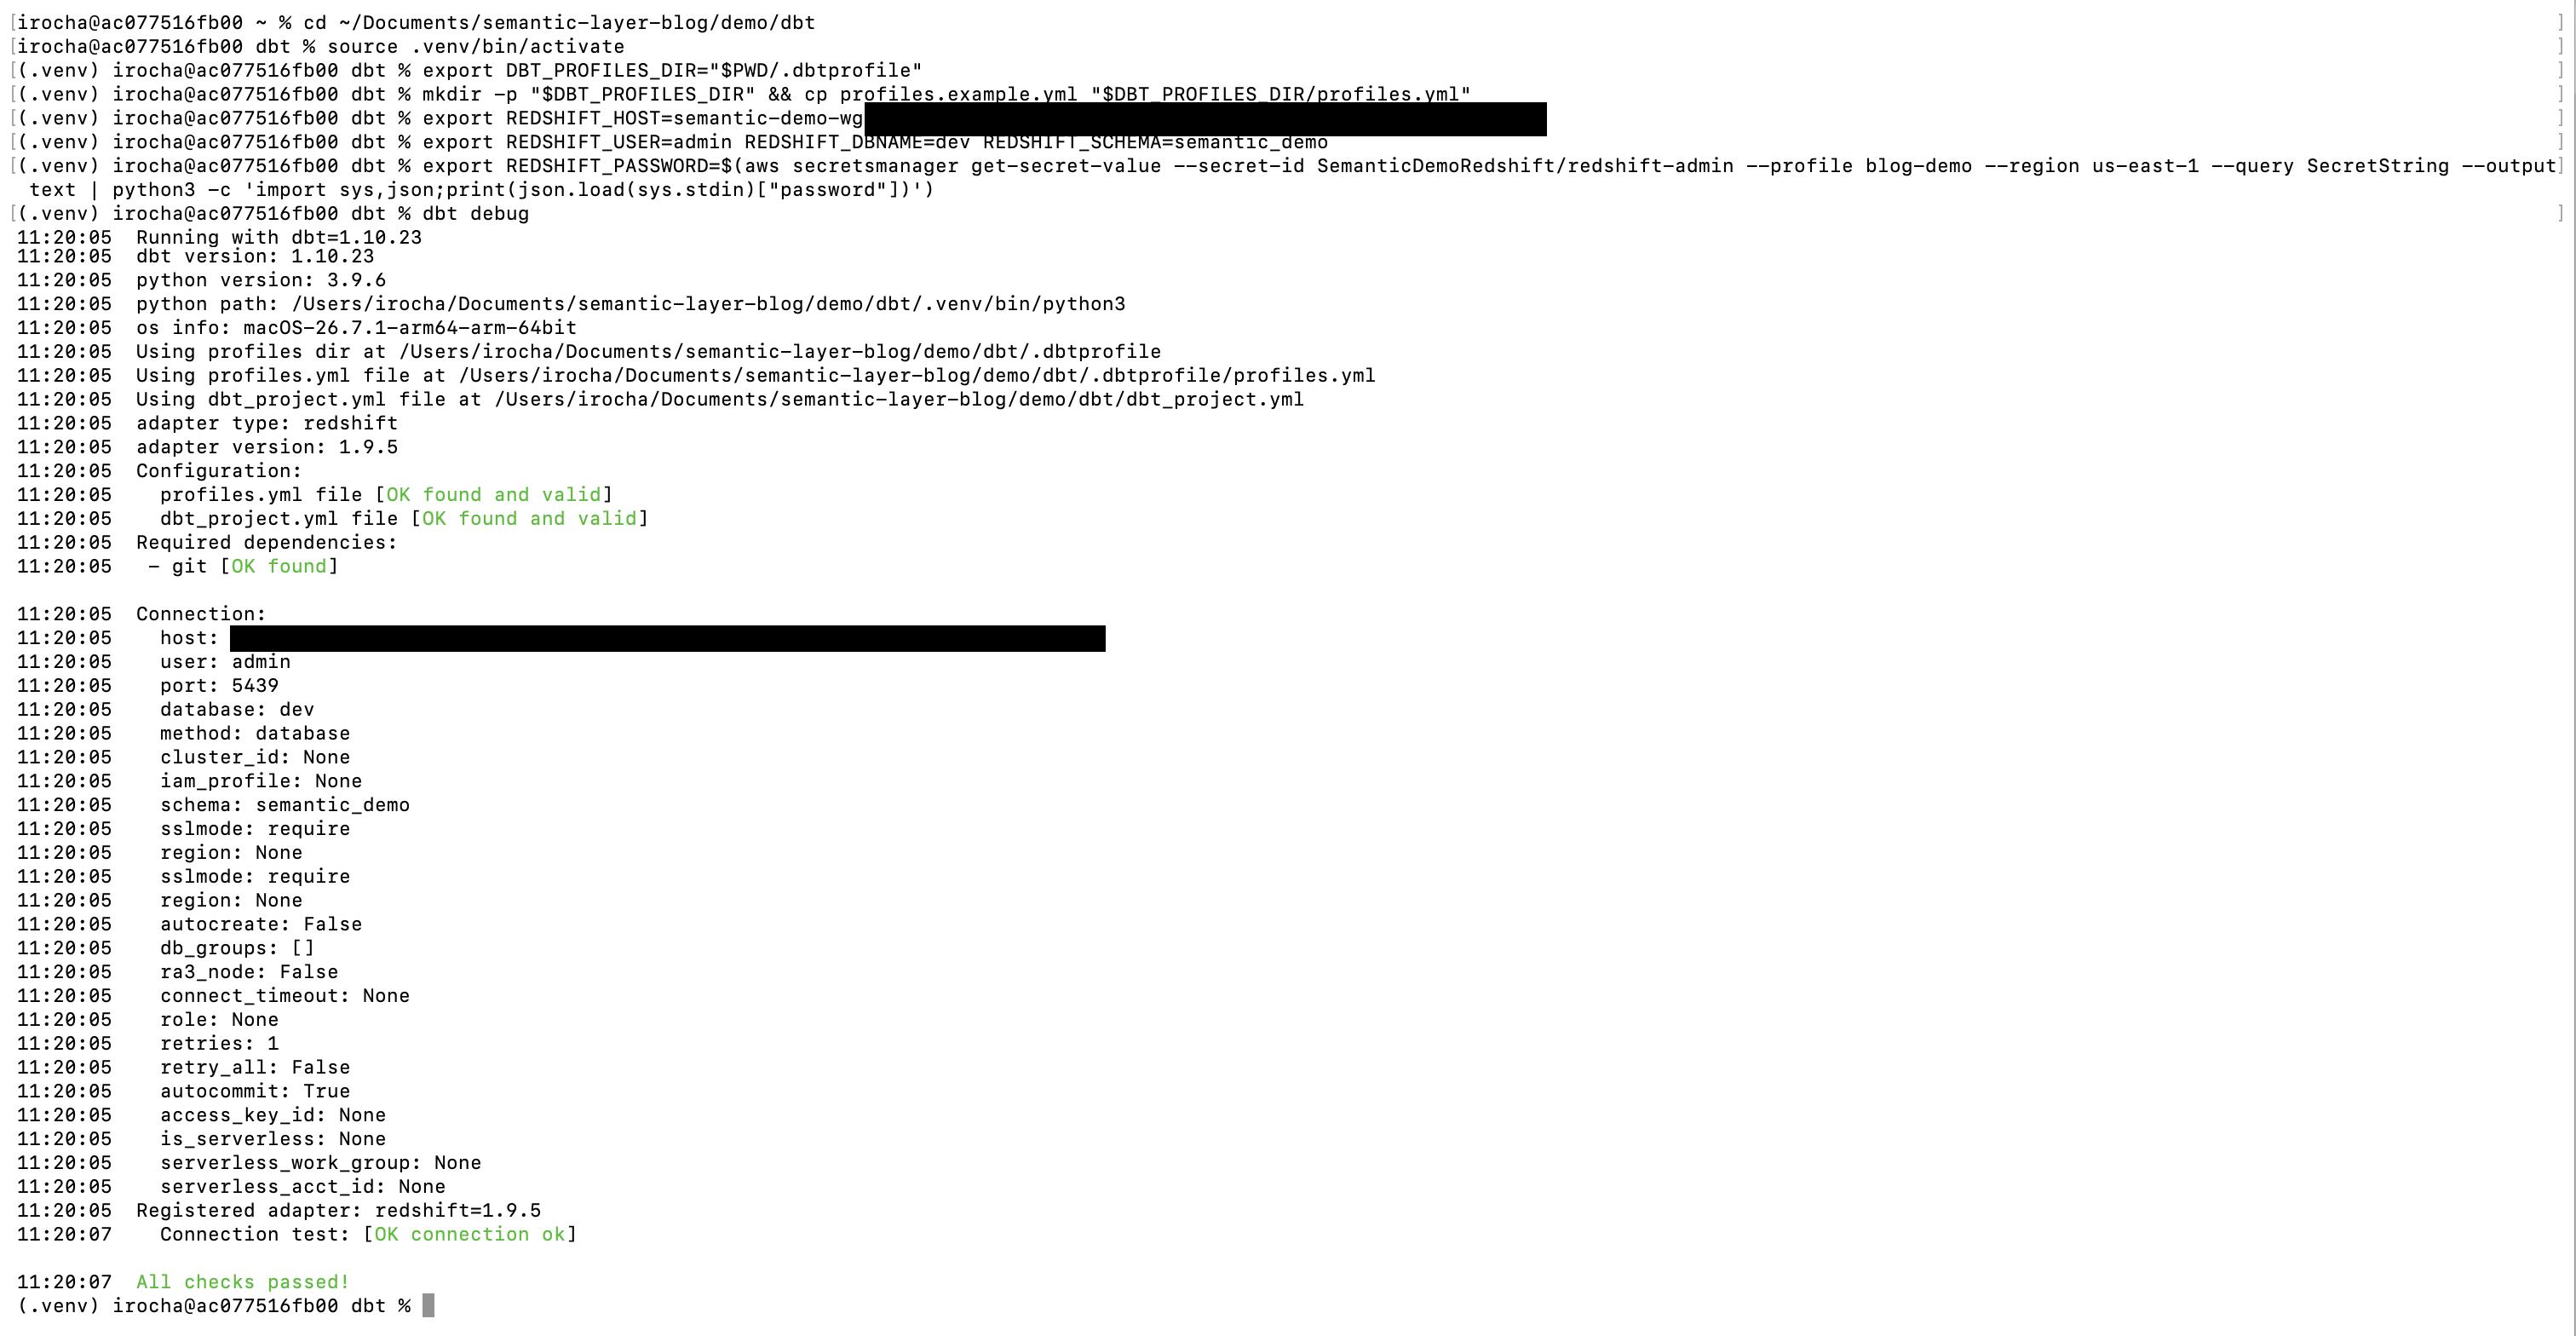
- Modeling: The dbt project establishes the core "fct_orders" table. Crucially, a "time spine" is created—a table of continuous dates that allows the system to aggregate data across any time window, from days to fiscal years, without missing values.
- Semantic Declaration: Within a configuration file, the "average_order_value" is defined as a ratio of "total_revenue" divided by "order_count." By defining it as a ratio, the system is programmed to always aggregate the numerator and denominator separately before performing the division, preventing the "average of averages" error.
- Validation: Using the MetricFlow CLI, engineers can validate that the metrics are correctly configured and test their behavior against various dimensions before the changes are deployed to production.
Chronology of Adoption
The movement toward metric-centric data modeling has gained significant traction over the last 24 months. Early adopters in the fintech and retail sectors, where high-volume transactional data is prone to aggregation errors, were the first to move away from static gold layers. By late 2024 and early 2025, the integration of dbt’s MetricFlow with cloud-native data warehouses like Amazon Redshift reached a point of maturity where the "pay-per-query" nature of serverless computing made these dynamic queries cost-effective.
Analysts note that this shift represents a transition from "data as tables" to "data as a service." By separating the definition of the metric from the physical table structure, organizations gain the agility to add new dimensions—such as "marketing channel" or "customer segment"—without requiring a complete rewrite of the underlying data pipelines.
Broader Impact and Implications
The implications for data governance are profound. When business logic is defined in code rather than hidden inside the proprietary settings of a BI tool, the logic becomes portable. The same "Average Order Value" definition can be shared across multiple consumption points—Tableau, Power BI, or even internal AI agents—ensuring that all stakeholders are looking at the same version of reality.
Furthermore, this approach mitigates the risk of "dashboard sprawl," where dozens of variations of the same report exist because different analysts have used slightly different SQL logic to arrive at their conclusions. By enforcing the metric definition at the semantic level, the organization ensures that the "truth" is centrally managed.
From a performance perspective, the trade-off is the overhead of dynamic query generation. While a pre-aggregated gold table is undeniably faster for simple queries, modern warehouses like Amazon Redshift are increasingly optimized for the types of aggregate functions required by semantic layers. As the complexity of organizational data grows, the cost of "wrong numbers" and "inflexible reports" far outweighs the marginal cost of the compute time required to resolve metrics at runtime.
Conclusion: Moving Toward Governance
The evolution of the semantic layer marks a critical juncture in the maturation of data engineering. While the gold layer remains the bedrock of performance for standard, additive reporting, the transition to a governed metric layer is essential for any organization that intends to perform advanced, multi-dimensional analysis.
By utilizing tools like dbt and MetricFlow on top of Amazon Redshift, teams can escape the combinatorial wall of pre-aggregation. The ability to define complex metrics once and ensure their mathematical integrity across any dimension is no longer a luxury but a requirement for modern, scalable data infrastructure. As AWS continues to integrate semantic knowledge into its broader service offerings, the convergence of warehouse-native logic and intelligent metadata will likely become the standard for enterprises aiming to reconcile the speed of self-service analytics with the necessity of governed, accurate data. Organizations that make this transition now will find themselves better positioned to support the next generation of data-driven applications, including those powered by generative AI, which rely heavily on accurate, well-defined metrics to function reliably.