Python 3.15 Introduces Tachyon: A Built-In, Zero-Overhead Sampling Profiler for Production Environments

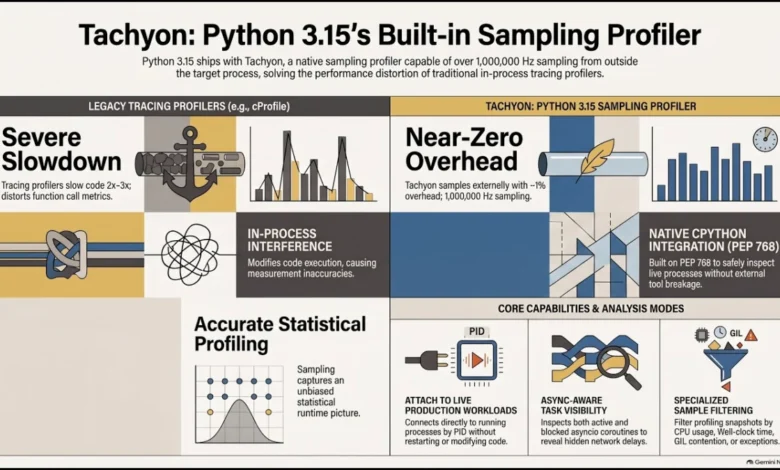
Performance optimization has long been one of the most persistent challenges in the Python ecosystem. For decades, developers seeking to diagnose performance bottlenecks in their CPython applications faced a difficult compromise. They could utilize tracing profilers—such as the standard library’s profile and cProfile modules—which track every single function call and return, but at the heavy cost of slowing execution down by a factor of two to three. Alternatively, they could rely on third-party tools that intercepted runtime state through memory inspection, but these external utilities frequently broke whenever a new minor or patch version of the Python runtime was released.
Python 3.15 fundamentally reshapes this landscape. Shipping directly inside the standard library, the new release introduces Tachyon, a high-frequency sampling profiler designed to attach to live, running production applications with near-zero performance overhead. This milestone is the culmination of extensive collaboration within the CPython core development community and infrastructure engineering teams at major financial institutions, promising to bridge the gap between development profiling and production observability.
The Evolution of Profiling: From Tracing to Sampling
Historically, Python developers relied on tracing profilers to map out application execution. While tracing provides absolute precision regarding function call counts and granular execution paths, the architectural mechanism requires the interpreter to notify the profiler on every entry and exit. In compute-heavy applications or tight execution loops, this constant context switching introduces severe overhead, skewing performance metrics and rendering the profiler unusable in high-throughput production environments.
To circumvent this, the industry increasingly turned to sampling profilers—external utilities that periodically interrupt the runtime to inspect the execution stack. Tools like Py-Spy and Austin demonstrated the immense value of non-invasive sampling. However, because these tools operated entirely externally, they relied on reverse-engineering internal CPython data structures, making them inherently brittle. Every internal optimization or restructuring within CPython risked breaking third-party profiling tools, creating an ongoing maintenance burden for tool authors and instability for enterprise users.
Recognizing this systemic friction, CPython core developers and infrastructure engineers initiated a project to bring a first-party sampling profiler directly into the runtime. The initiative aimed to unify profiling capabilities within the standard library while establishing a stable, officially supported contract between the interpreter and diagnostic tools.
From Concept to Execution: The Genesis of Tachyon
The development of Tachyon began in earnest during the community sprints at PyCon US, bringing together Pablo Galindo Salgado—a CPython core developer and Steering Council member—and Laszlo Kiskoller from Bloomberg’s Python infrastructure team.
In its earliest prototype phase, the profiler operated at a modest rate of roughly two samples per second, rendering it largely ineffective for capturing transient performance anomalies. Through iterative algorithmic refinement and deep integration with CPython’s execution engine, the engineering team achieved exponential performance gains. By the end of the development cycle, the sampling engine was capable of executing over one million hertz of sampling frequency while maintaining negligible runtime intrusion.
The technical foundation enabling this performance breakthrough was formalized through PEP 768, which establishes a safe external debugger and introspection interface for CPython. By exposing these introspection capabilities natively, Tachyon eliminates the guesswork traditionally associated with production diagnostics.
Technical Architecture and Operational Modes
Tachyon distinguishes itself through its flexibility, offering multiple operational modes tailored to different diagnostic scenarios. Unlike traditional profilers that offer a one-size-fits-all approach, Tachyon provides specialized filters to isolate specific performance characteristics:
- Wall Clock Mode: The default operating mode, capturing the total elapsed time of execution, inclusive of I/O operations, network wait times, and system sleep intervals. This provides a holistic view of overall application latency.
- CPU Mode: Filters out idle time, network latency, and disk waiting periods, isolating pure processor-bound execution. This enables developers to pinpoint inefficient algorithms, heavy data processing loops, and parsing overhead.
- GIL Mode: Analyzes thread behavior relative to the Global Interpreter Lock (GIL), shedding light on thread contention and scheduling efficiency—a particularly valuable metric as the Python ecosystem navigates the transition toward free-threaded execution.
- Exception Mode: Quantifies the performance cost associated with exception handling, helping developers identify scenarios where exceptions are inadvertently utilized for control flow within tight loops.
Furthermore, Tachyon introduces asynchronous coroutine profiling, providing visibility into event loop execution dynamics—a capability historically difficult to achieve with traditional tooling. Developers can inspect running tasks, analyze asynchronous wait states, and generate comprehensive flame graphs or differential visualizations to compare performance regressions across code modifications.
Broader Implications for the Python Ecosystem
The introduction of Tachyon in Python 3.15 marks a maturation point for enterprise Python deployments. By providing a zero-overhead, production-safe profiling mechanism out of the box, Python removes a major operational barrier for high-scale web services, financial trading systems, and data-intensive scientific applications.
Engineering teams no longer need to rely on ad-hoc profiling scripts or risk deploying unstable third-party extensions into production clusters. Instead, they can safely attach to live processes, diagnose bottlenecks in real-time, and extract precise telemetry with minimal computational penalty. As organizations increasingly demand deep observability into their software stacks, Tachyon positions Python to meet modern enterprise performance standards natively, reinforcing its status as a premier language for high-performance distributed systems.