Mastering Data Visualization: How AI is Transforming the Way Analysts Choose and Build Effective Charts

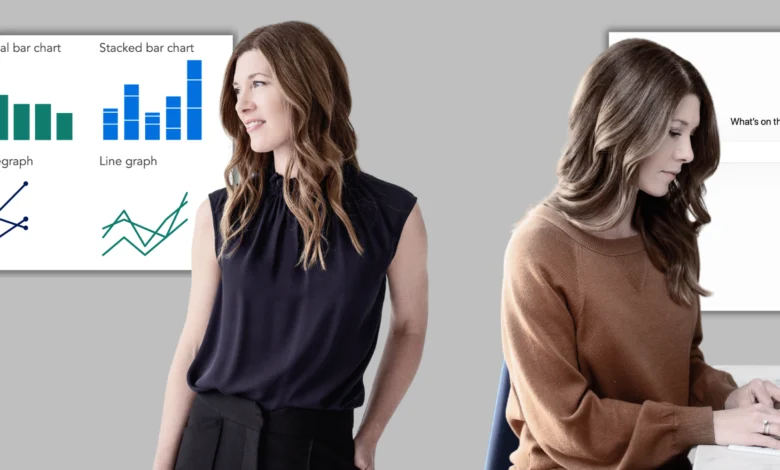
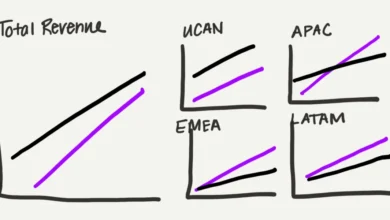
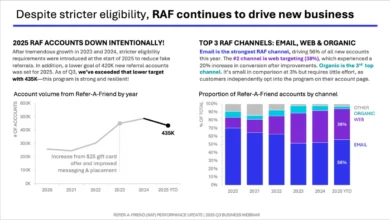
The evolution of workplace analytics has fundamentally shifted how organizations communicate complex operational truths to executive leadership. While traditional data visualization has long relied on standard frameworks—such as bar charts for cross-category comparisons, line graphs for temporal trends, and slopegraphs for tracking change between two points—the methodology behind selecting these visual mediums is undergoing a massive transformation. Historically, charting data was a tedious, linear trial-and-error process where analysts would build a visual, realize it obscured the primary message, and manually start over. Today, the integration of artificial intelligence into the data visualization workflow is accelerating this iterative process, allowing professionals to rapidly prototype, evaluate, and refine visual assets before investing significant time into final production.
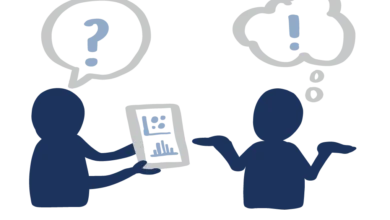
This methodological evolution sits at the intersection of human strategic insight and machine-learning efficiency. According to recent industry observations within data storytelling frameworks, the fundamental rule of visualization remains unchanged: familiarity breeds comprehension. Audiences should never be forced to decode an unfamiliar visual architecture simply to understand a core business message. However, the path to arriving at the ideal, intuitive chart format has been notoriously inefficient. By leveraging AI as a collaborative thought partner, data teams can bypass manual trial-and-error phases, testing multiple visual hypotheses simultaneously to determine which format best serves their overarching narrative.
The Mechanics of AI-Assisted Chart Prototyping
Integrating artificial intelligence into the visual selection process requires a shift in how analysts interact with raw datasets. Traditionally, data visualization textbooks advise cleaning, aggregating, and structuring data prior to rendering any visual output. AI-driven workflows, however, short-circuit this administrative bottleneck. An analyst can feed raw, unrefined data tables directly into a large language model alongside a clearly articulated takeaway statement and audience profile, asking the system to act as a critical sounding board.
The process begins long before pixels hit a screen. Analysts must first establish a robust context, a step often cultivated through structured storyboarding and the formulation of a singular "Big Idea." Once the core message is defined—such as demonstrating a spike in early-tenure employee attrition following the implementation of a hybrid work policy—the AI prompt acts as a catalyst. Rather than relying on the machine to make final executive decisions, the analyst tasks the AI with generating multiple visual prototypes alongside a rigorous breakdown of their respective tradeoffs.
For instance, an AI might suggest a grouped bar chart, a slopegraph, and a dumbbell plot for the same dataset. Crucially, it will articulate what each option makes immediately transparent to the viewer and what contextual nuances each format inherently obscures. This capability allows human operators to apply their deep contextual knowledge of organizational politics, audience skepticism, and presentation goals to evaluate the machine-generated options effectively.
Navigating Tool Capabilities and Technical Pitfalls
Despite the rapid proliferation of artificial intelligence tools, practitioners must navigate significant technological disparities across platforms and account tiers. In evaluating current market offerings, industry testing reveals a stark divide in chart-rendering capabilities. While nearly any mainstream AI model can assist with the conceptual, text-based planning and storyboarding phases, the ability to render actual, high-fidelity chart images varies wildly.
Free-tier models often struggle with visual rendering, frequently defaulting to text-based approximations, ASCII art, or raw code blocks rather than producing cleanly formatted image files. In comparative testing across leading platforms—including Microsoft Copilot, OpenAI’s ChatGPT, Google Gemini, and Anthropic’s Claude—free versions of Gemini and Claude consistently outperformed competitors in producing renderable visual outputs. Conversely, paid subscription tiers across all major platforms generally delivered superior, production-ready results.
For analysts operating without access to enterprise-grade or paid subscriptions, Google Gemini currently stands out as the most reliable free-tier option for visual prototyping. Alternatively, cross-platform prompting—wherein an analyst copies a standardized prompt across multiple distinct AI tools—remains a viable strategy to harvest a diverse array of visual approaches and code snippets for further refinement.
A Practical Blueprint: People Analytics in Action
To understand how this workflow operates in a corporate environment, consider a case study involving a People Analytics Manager at a mid-sized management consulting firm. Following an exhaustive examination of the company’s hybrid work policy—which currently mandates three days in-office and two days remote for all personnel—the analytics team uncovers compelling correlations. By analyzing performance ratings, badge-swipe attendance logs, collaboration network density, and attrition metrics, the team reaches a definitive conclusion: the blanket policy is failing early-tenure professionals. The data indicates a severe spike in voluntary departures among new hires, prompting a recommendation to transition from a rigid, one-size-fits-all mandate to a flexible, role-based hybrid model.
To convince a skeptical and divided leadership team, the analytics manager must craft a compelling presentation arc. For the specific slide addressing early-tenure attrition, the manager deploys Google Gemini using a structured, multi-variable prompt:
"My audience is a leadership team with divided opinions and high stakes in the outcome. I want to show that early-tenure attrition has spiked significantly since we implemented the hybrid work policy. This graph will be a single data slide within a larger live presentation, with the ultimate goal of persuading leadership to adopt a differentiated policy. Here is my raw data table containing pre- and post-policy attrition rates segmented by role type and tenure. Please generate two to three chart options, render them visually, and explain the analytical tradeoffs of each."
In response, Gemini initiates a clarifying dialogue, probing into potential pushback vectors, whether flexibility will be determined by tenure or job function, and the leadership board’s historical appetite for unconventional data visualizations. Upon confirming these parameters, the AI generates three distinct visual prototypes: a slopegraph, a grouped bar chart, and a dumbbell plot. Furthermore, the AI applies strategic color theory to the prototypes—employing neutral gray tones to represent the pre-policy baseline and stable mid-to-senior tenure segments, while utilizing a stark, high-contrast red to immediately draw the eye to the anomalous spike in early-tenure attrition post-policy.
Broader Implications for Enterprise Data Culture
The integration of artificial intelligence into data visualization does not eliminate the need for human expertise; rather, it elevates the analyst from a manual draftsperson to a strategic communications director. By offloading the mechanical friction of chart generation and visual experimentation, analysts can spend more time interrogating their data for hidden biases, refining narrative arcs, and anticipating audience objections.
As these generative tools continue to evolve, the barrier to creating publication-quality analytics is dropping precipitously. Organizations that successfully train their workforces to partner effectively with AI for visual prototyping will likely see faster consensus-building, higher data literacy among executives, and ultimately, more evidence-based decision-making. However, this technological leap carries a permanent caveat: the human creator remains entirely responsible for the factual accuracy, ethical representation, and contextual integrity of the final visual artifact presented to the world.