Mastering Data Storytelling: How to Transform Cluttered Corporate Metrics into Actionable Insights for Executive Leadership

In the modern corporate ecosystem, data is often heralded as the ultimate currency. Yet, the proliferation of business intelligence tools has created a paradoxical challenge: while organizations are collecting more information than ever before, the ability to communicate meaningful insights to executive leadership is increasingly compromised. When operational metrics—such as expected staffing shortfalls—are brought to the attention of leadership, raw forecasts alone rarely provide the necessary context. Leaders require more than just a glimpse of a gap; they need to understand its origins, its trajectory, and the strategic implications required to mitigate it.
This fundamental communication barrier was recently highlighted during a custom data storytelling workshop conducted for a corporate client. The organization faced a multifaceted communication challenge that is common in enterprise environments: the internal analytics team needed to demonstrate that full-time equivalent (FTE) staffing levels were projected to fall significantly below corporate targets, that a distinct contraction in operations support roles was serving as the primary catalyst for this decline, and that executive leadership needed to immediately deliberate on a corrective course of action. While all the critical data points were present within the team’s initial reporting documents, the core narrative was effectively buried beneath layers of visual complexity.
The Anatomy of a Cluttered Dashboard: Why Traditional Reporting Fails
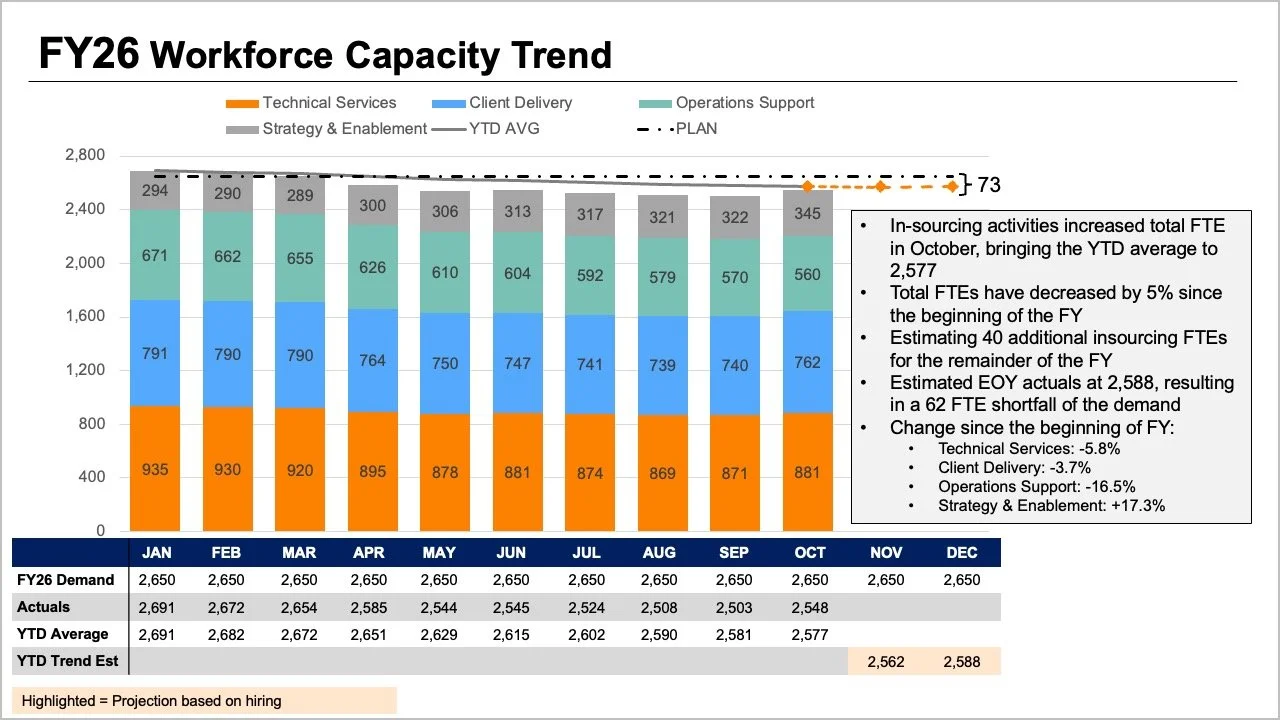
The root of the problem lay in the original slide design, which demanded that readers process multiple complex variables simultaneously. The top of the visualization featured stacked bars, trend lines, and a comprehensive data table, all attempting to communicate overall FTE metrics through divergent visual mechanisms. Furthermore, individual segments within the stacked bars illustrated a granular breakdown by specific employee roles, while additional layers of data—encompassing annual plans, actual figures, year-to-date averages, and forward-looking projections—further complicated the interpretive burden.

Each individual element within the graphic addressed a reasonable and legitimate business question. However, when crammed together into a single, monolithic visualization, they created cognitive overload, making it nearly impossible for an executive to answer any single question with confidence.
To resolve this, analysts had to step back and evaluate the core informational requirements of the executive suite. Ahead of any high-stakes strategic meeting, leadership generally seeks answers to two fundamental inquiries: First, what is the magnitude of the expected workforce shortfall? And second, what do the most recent staffing diagnostics reveal regarding where these structural shifts are taking place? Rather than forcing all of this disparate information into a single, congested graph, communication experts recommend decoupling the data into distinct, specialized views—assigning precisely one visual medium to each core question.
Visualizing the Macro Trend: Employing the Standalone Line Chart
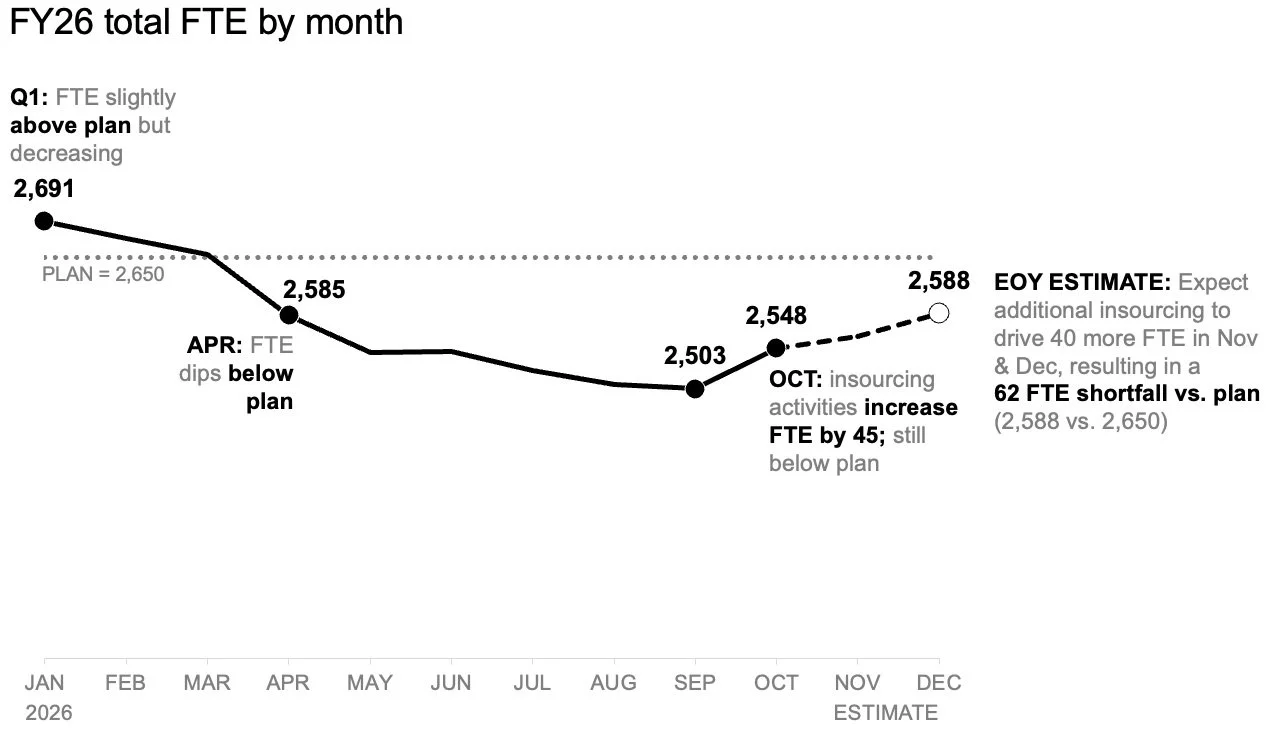
To address the first critical question concerning the anticipated workforce deficit, analysts must first isolate the macro-level trajectory. The most effective instrument for this purpose is a streamlined, standalone line chart.
By removing the noise of role-level breakdowns and auxiliary data tables, a clean line chart allows executives to immediately evaluate how staffing levels have tracked against the baseline plan established at the beginning of the fiscal year. Crucially, it provides a clear comparative view of how future forecasts diverge from that original plan.
Furthermore, this uncluttered architectural approach leaves ample whitespace for targeted annotations at critical inflection points. Instead of spending precious meeting minutes decoding a dense legend or cross-referencing a data table, readers can focus their cognitive energy entirely on the expected gap to plan. This foundational clarity sets the stage for a more productive, evidence-based dialogue among decision-makers.
Deconstructing Granular Shifts: The Power of the Slopegraph
Once the macro trend has established the overarching deviation from annual targets, leadership naturally turns to the micro-level drivers: specifically, which organizational segments are experiencing the most pronounced contractions?
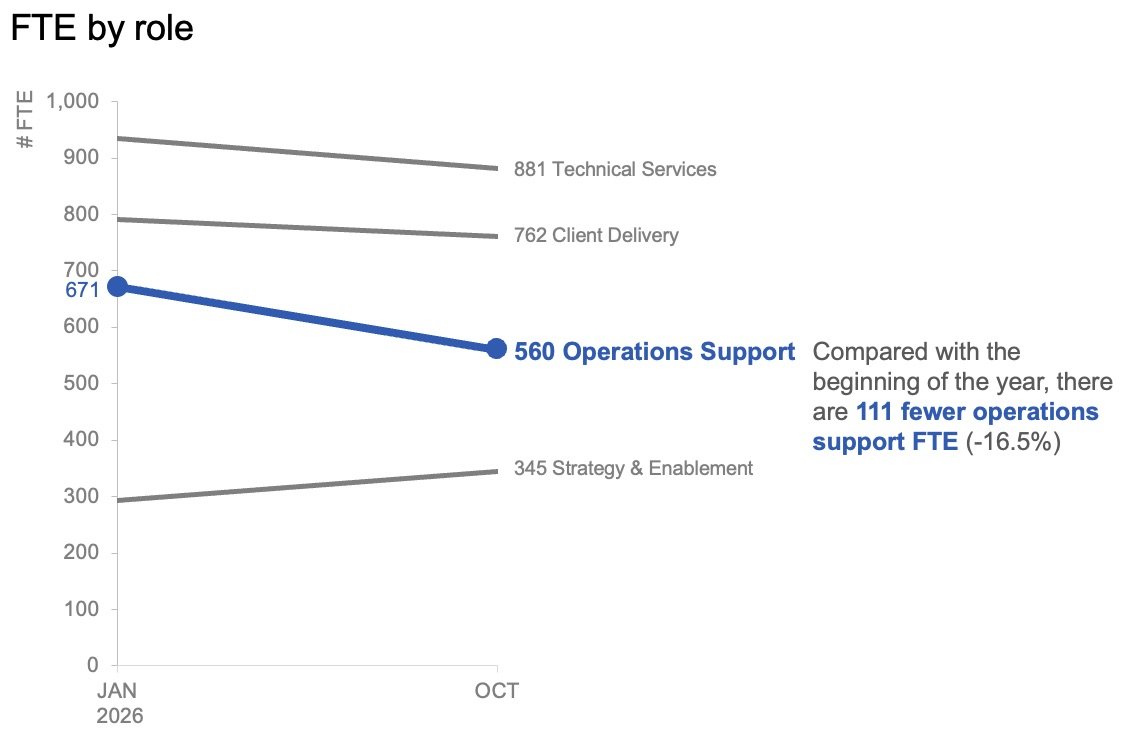
In addressing role-level changes within actual operational data, month-to-month fluctuations often introduce unnecessary volatility that can obscure the true trajectory. To circumvent this, data visualization specialists frequently utilize a slopegraph. By plotting only two distinct points in time—typically the start of the fiscal year and the most recent actual reporting month—a slopegraph provides an instantaneous, highly legible depiction of relative movement across various job categories.
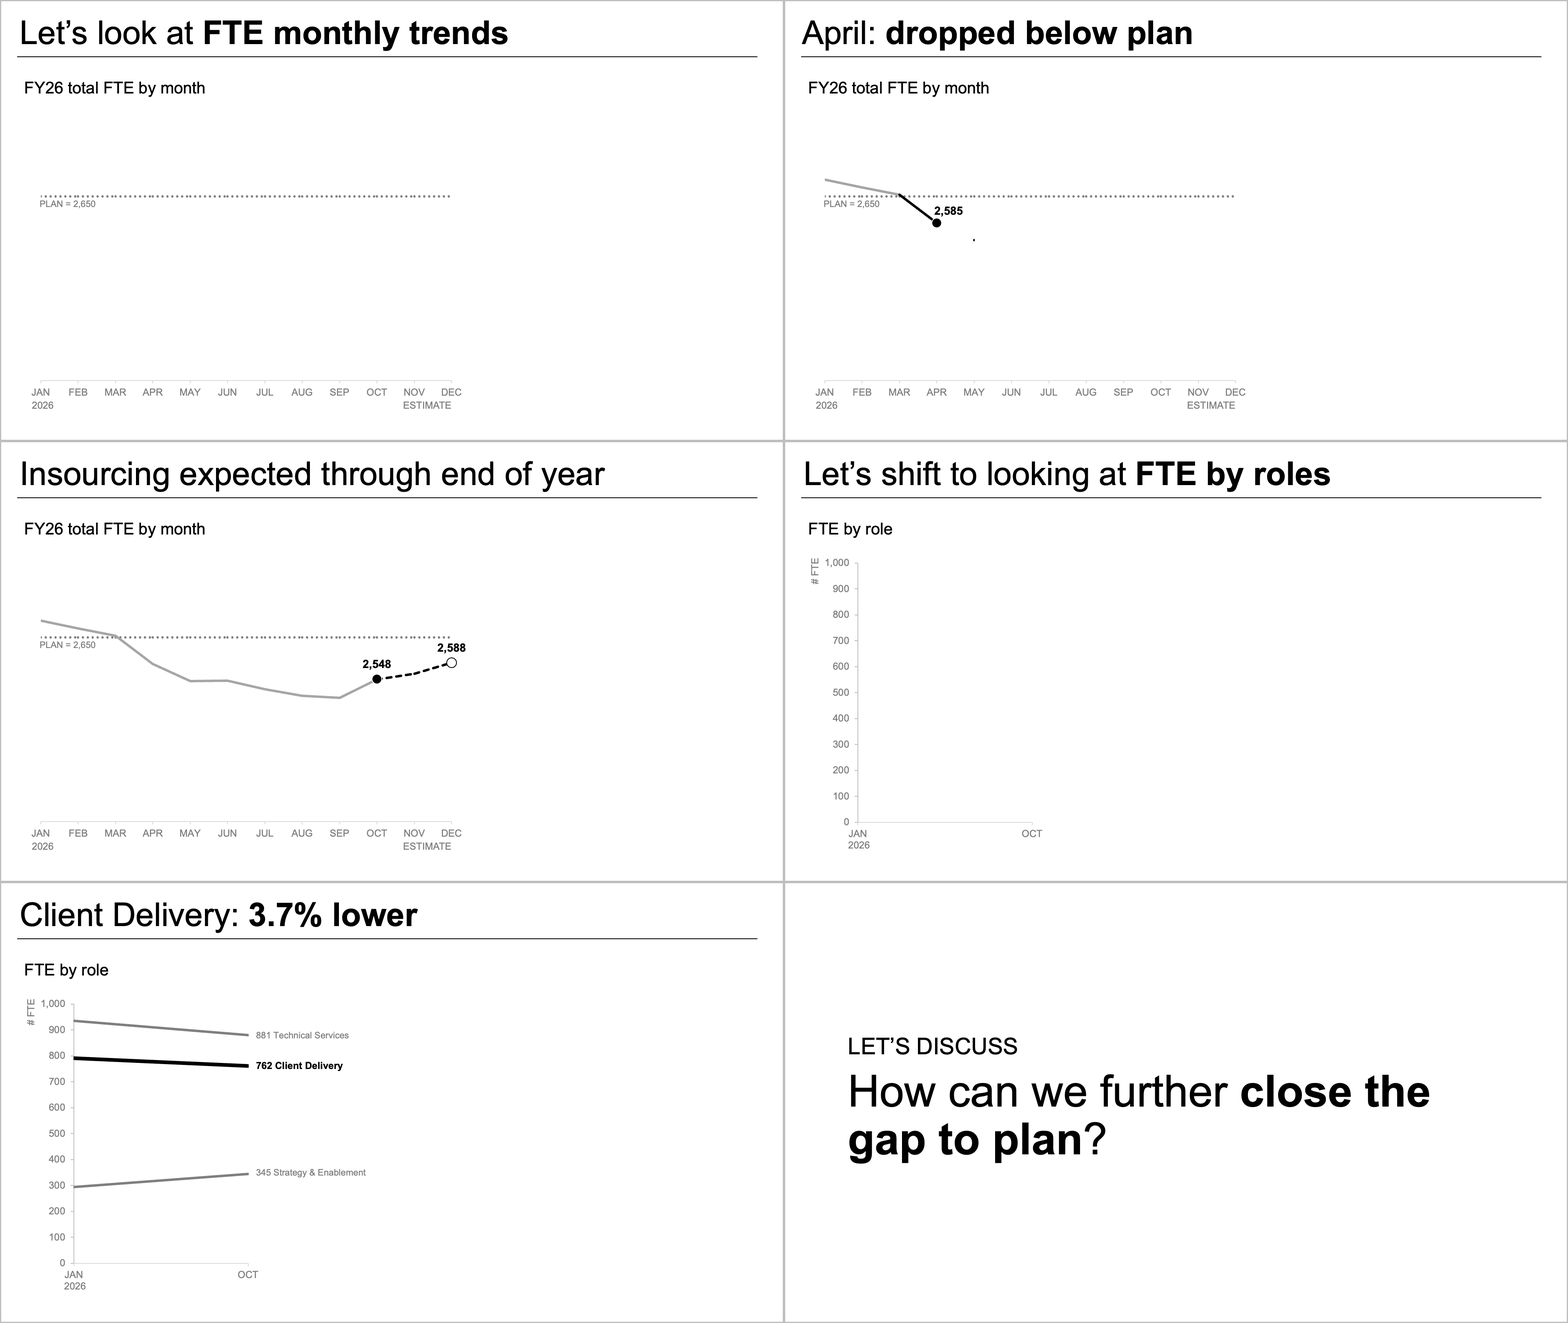
In the case of the client workshop, applying a slopegraph immediately brought structural realities to light. By utilizing color and textual emphasis with extreme restraint—drawing the eye specifically toward the steep decline in operations support roles—the audience was able to instantly comprehend the primary driver of the overarching FTE shortfall without having to parse a complex grid of numbers.
Synchronizing Visuals for Static Reports Versus Live Presentations
A critical consideration in professional data communication is the medium through which the information will be consumed. A static document intended for asynchronous review—such as a report attached to an executive briefing packet or forwarded via email—requires a different structural approach than a live, synchronous presentation delivered in a boardroom.
For asynchronous distribution, both the macro line chart and the micro slopegraph can be presented together within a single unified view or page. In this format, a clear, action-oriented slide title explicitly states the expected workforce shortfall, while concise supporting text directs the reader’s attention to the contraction in operations support roles and signals the imperative for executive deliberation. The charts provide rigorous empirical evidence without competing for visual dominance.
Conversely, during a live presentation, a presenter must carefully manage the cognitive pacing of the audience. Rather than exposing stakeholders to the complete analytical summary all at once—which often invites premature debate on peripheral details—the presenter can adopt a sequential disclosure strategy. The discussion begins by walking through the overall workforce forecast using the standalone line chart. Once the macro reality is fully absorbed, the presenter reveals the actual role-level changes piecewise via the slopegraph. Finally, the conversation pivots naturally to strategic remediation and next steps.
This phased methodology ensures that the audience thoroughly digests each logical building block before advancing to the next, preserving the integrity of the core narrative.
Strategic Implications and Broader Corporate Lessons
The challenges faced by this client reflect a universal hurdle across the corporate landscape: the dangerous assumption that data transparency is synonymous with data volume. When organizations confront negative variances—such as unexpected labor shortages or budget deficits—the institutional reflex is frequently to over-document, packing every available metric onto a single slide or dashboard in the interest of perceived thoroughness.
However, modern management theory and data visualization best practices consistently demonstrate that more information does not automatically equate to higher understanding. In fact, excessive visual density often paralyzes decision-making, obfuscating the actionable insights that leaders desperately need to navigate operational headwinds.
By systematically decoupling macro-level forecasts from micro-level departmental shifts, organizational analysts can transform convoluted administrative reports into compelling, transparent narratives. Whether the objective is addressing FTE shortfalls, supply chain bottlenecks, or financial variances, the underlying principle remains unchanged: give each distinct business question its own dedicated visual space. By respecting the cognitive limits of executive audiences and structuring data with purposeful intent, organizations can bridge the perennial gap between complex analytics and decisive corporate leadership.