Python 3.15 Set to Transform Application Performance with the Introduction of Tachyon, a High-Performance Built-In Sampling Profiler

Identifying performance bottlenecks in complex Python applications has long presented a significant engineering hurdle. Historically, developers seeking to diagnose slow code faced a difficult choice between tracing profilers that severely degrade application execution speeds by factors of two to three, and fragile third-party tools that frequently break with minor runtime updates. This landscape is set to shift fundamentally with the upcoming release of Python 3.15, which introduces Tachyon—a native sampling profiler integrated directly into the standard library. Designed to attach to live production applications with virtually zero overhead, Tachyon marks a major milestone in the ongoing evolution of the CPython runtime.
The Architectural Limitations of Legacy Python Profiling
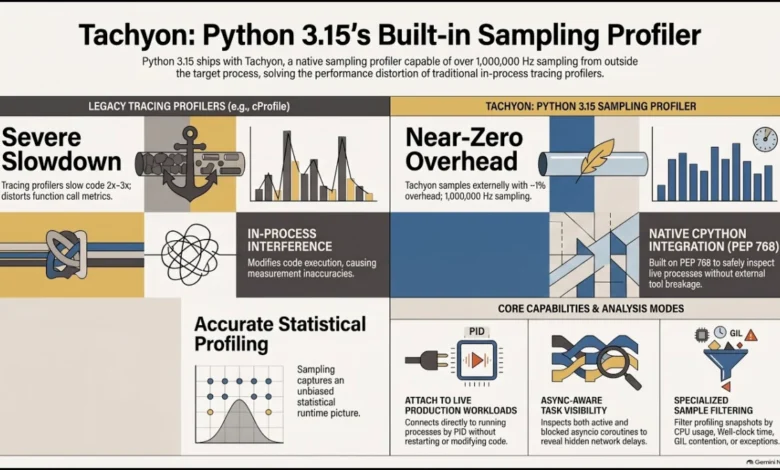
To understand the significance of Tachyon, one must examine the limitations of traditional Python profiling tools. For decades, the standard library offered two primary tracing profilers: the pure Python profile module and its C-optimized counterpart, Cprofile. While these tools provide comprehensive function-call data, their underlying architecture creates inherent performance penalties.
Tracing profilers operate by intercepting every single function call and return within a program. This mechanism requires the runtime to execute monitoring hooks for every operation, artificially inflating execution times and skewing results—a phenomenon where the act of measurement significantly alters the system being measured. Consequently, running a tracing profiler in a production environment is rarely viable, as it can slow a system to a crawl and introduce severe latency for end-users.
Alternative third-party solutions, such as Py-Spy or Austin, approach the problem differently by operating as external processes that read interpreter memory structures. While these sampling profilers avoid intrusive code instrumentation, they rely heavily on undocumented CPython internal data layouts. As a result, runtime updates frequently break compatibility, requiring maintainers to scramble for patches with every new minor version of Python. Furthermore, these external tools often require elevated operating system privileges to attach to live processes, introducing security and deployment friction in tightly locked-down cloud environments.
The Genesis and Engineering Evolution of Tachyon
The development of Tachyon addresses these systemic issues by combining the safety and stability of a standard-library feature with the low overhead of a modern sampling profiler. The project originated from collaborative engineering efforts between CPython core developers and infrastructure teams at major financial institutions, notably featuring Pablo Galindo Salgado—a CPython core developer and Steering Council member—alongside Laszló Kiss-Kollár from Bloomberg’s Python infrastructure team.
The conceptual breakthrough began during development sprints where engineers sought to leverage modern debugging and introspection interfaces being built into CPython, such as the safe external debugger infrastructure outlined in PEP 768. Early prototypes of the sampling profiler were rudimentary, managing a modest sampling rate of approximately two samples per second. Through rigorous optimization of the CPython runtime interaction layers, memory reading mechanisms, and symbol resolution pipelines, the engineering team systematically dismantled performance bottlenecks.
By the time the architecture matured for inclusion in Python 3.15, Tachyon’s sampling frequency scaled past one million hertz under optimal conditions. This unprecedented performance ceiling allows developers to capture high-resolution statistical representations of application behavior without impacting production stability.
Core Features and Technical Capabilities of Tachyon
Integrated formally under the restructured profiling namespace—alongside streamlined tracing options via PEP 799—Tachyon provides a comprehensive suite of diagnostic modes tailored for both local development and live production triage.
Low-Overhead Production Attachment
Tachyon utilizes non-blocking sampling techniques by default, querying the interpreter state with minimal CPU interference. Under standard production sampling rates (such as 100 to 1,000 hertz), performance overhead remains negligible, typically hovering between 1% and 2%. For scenarios requiring absolute data consistency without partial frame reads, an optional blocking mode briefly pauses execution for microscopic intervals, ensuring high-fidelity stack captures while maintaining production viability.
Multi-Mode Diagnostic Filtering
Modern applications rarely run as simple, single-threaded scripts. Tachyon addresses this complexity by offering specialized operational modes:
- Wall Clock Mode: Captures total elapsed time, revealing systemic delays caused by disk I/O, network latency, or deliberate execution pauses (such as
time.sleep). - CPU Mode: Filters out waiting states, focusing strictly on active computation cycles to help developers pinpoint inefficient algorithms and heavy data-processing loops.
- GIL Mode: Analyzes Global Interpreter Lock contention in multi-threaded environments, providing visibility into thread scheduling and execution bottlenecks.
- Exception Mode: Measures the computational overhead generated by exception handling, helping teams identify misuse of exceptions for control flow in tight iteration loops.
Rich Ecosystem Visualization
Rather than dumping raw text files or proprietary formats, Tachyon natively outputs standard visualization structures, including flame graphs, interactive terminal-based live views (similar to system monitoring tools like top), differential flame graphs for comparing code revisions, and asynchronous call stack tracking for complex event loops.
Broader Industry Implications and the Future of CPython Performance
The release of Python 3.15 arrives amid a broader industry push toward high-performance Python execution, complementing initiatives like the Faster CPython project, the emerging JIT compiler, and the stabilization of free-threaded Python (PEP 703). As Python expands deeper into high-throughput web services, massive data processing pipelines, and low-latency algorithmic trading environments, the demand for robust observability tools has never been higher.
By standardizing a high-performance sampling profiler within the core runtime, the CPython development community has established a reliable baseline for performance analysis. Engineers no longer need to rely on brittle, out-of-tree utilities or accept the severe performance penalties of legacy tracing profilers. With Tachyon embedded directly into the language, diagnosing complex runtime behavior in live production environments transitions from a speculative guessing game into a precise, data-driven science.