and Human Insight Drive Effective Data Storytelling
In the modern enterprise, organizations collect vast quantities of operational data, ranging from customer service call volumes and supply chain metrics to employee productivity scores and server utilization rates. Yet, the presence of data does not automatically equate to operational clarity. A persistent challenge across industries is the translation of raw metrics into actionable intelligence that non-technical decision-makers can immediately operationalize. Recent findings in data communication and visualization emphasize that the strategic deployment of text—specifically titles, labels, and annotations—acts as the crucial bridge between raw analytics and organizational execution.
This challenge has become increasingly pronounced with the rapid integration of artificial intelligence into corporate reporting workflows. While generative AI tools have demonstrated a remarkable capability to process datasets, identify statistical patterns, and draft polished descriptive summaries, industry analysts point out a fundamental limitation: AI often stops at observation rather than reaching true insight. Transforming a chart into a driver of business behavior requires a deep understanding of organizational context, human psychology, and audience intent—elements that remain firmly within the domain of human expertise.
Anatomy of an Effective Data Visualization
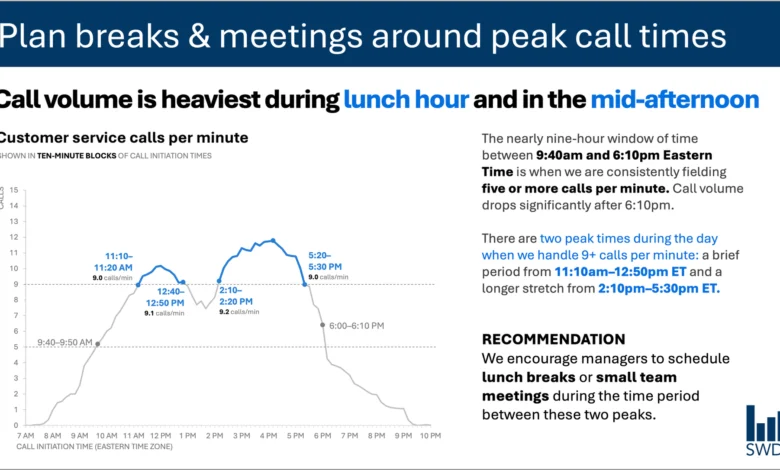
To understand the mechanics of effective data storytelling, communications experts frequently examine standard operational dashboards, such as those tracking customer service call volumes throughout a business day. In a standard visualization without contextual framing, a line graph might simply illustrate a well-known diurnal pattern: call volumes begin to climb steadily in the morning, remain at an elevated plateau throughout the core working hours, and exhibit distinct spikes around the standard lunch hour and the mid-afternoon.
Viewed in a vacuum, this chart merely presents historical telemetry. However, the nature of the communication changes fundamentally when the intended audience is identified as workforce staffing managers. These individuals are not viewing the data out of academic curiosity; their primary mandate is optimizing operational efficiency, managing labor costs, and maintaining employee morale through effective scheduling.
When designing a data artifact for this specific audience, every textual element on the slide or dashboard must perform a distinct, measurable job. Rather than leaving the viewer to interpret the implications of the morning climb and afternoon peaks, an optimized visualization employs a structured hierarchy of text. At the apex sits the takeaway title—for instance, "Plan breaks and meetings around peak call times"—which immediately informs the manager of the core strategic imperative. Below this, a precise descriptive title, such as "Customer service calls per minute," grounds the viewer in the exact metric being evaluated.
Furthermore, targeted annotations can be embedded directly into the visual field to highlight the exact timestamps when call volumes cross critical operational thresholds. Finally, clear actionable recommendations translate the statistical findings into operational policy, suggesting that supervisors schedule lunch rotations and brief team huddles precisely during the lulls between the morning, midday, and afternoon peaks.
The Fallacy of Minimalism in Corporate Design
A common misstep in corporate presentations and dashboard design is the conflation of minimalism with clarity. Driven by the philosophy that "less is always more," designers frequently strip away surrounding text, footnotes, and contextual labels in pursuit of a clean, uncluttered aesthetic. While visual breathing room is essential for cognitive processing, the wholesale removal of explanatory text often renders complex data ambiguous and therefore useless.
Industry specialists emphasize that reducing the word count on a slide is only beneficial if the remaining words are precisely targeted and functionally necessary. Eliminating every sentence surrounding a complex graph might result in a minimalist layout, but it strips away the cognitive scaffolding the audience requires to bridge the gap between observation and action. Effective communication is not about achieving the lowest possible word count; it is about ensuring that every word serves a distinct operational purpose.
Different Words Do Different Jobs
Establishing a rigorous framework for data design requires categorizing the specific functions that text can perform within a visual display. When designing a slide, report, or dashboard, communications professionals must evaluate what the audience requires at each stage of the cognitive journey.
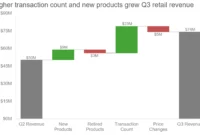
Takeaway titles are designed to communicate the primary conclusion or the recommended course of action, answering the audience’s unspoken question: "What should I do with this information?" Descriptive titles, conversely, orient the viewer by clearly stating the parameters of the data visualization, identifying variables, timeframes, and measurement units.
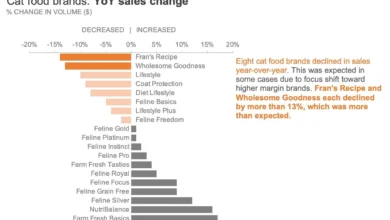
Direct data labels serve to eliminate the cognitive friction associated with checking a legend. By placing labels directly adjacent to the data points, trend lines, or bars they represent, designers reduce the mental effort required to cross-reference visual elements with peripheral keys. Annotations provide qualitative depth, explaining anomalies, highlighting systemic shifts, or offering contextual background that numbers alone cannot convey. Finally, supplementary text such as axis titles, source citations, and methodological footnotes preserve institutional integrity and allow for deeper auditing when necessary.
Not every visualization requires the simultaneous deployment of all these textual elements. The guiding principle is intentionality. Designers must interrogate their own layouts by asking targeted questions: What specific foundational knowledge does the audience need to comprehend this graphic? What action should they take as a direct result of this exposure? Where can a carefully chosen phrase eliminate ambiguity and solidify the core message? Once these questions are answered, extraneous text that fails to advance the narrative can be systematically eliminated.
The Intersection of Artificial Intelligence and Human Insight
As organizations increasingly adopt automated reporting tools and AI-driven analytics suites, the division of labor between human professionals and machine algorithms has emerged as a central theme in modern productivity discussions. When fed a structured dataset containing customer service call volumes, a modern large language model can rapidly ingest the figures, detect the underlying temporal patterns, and generate a grammatically flawless descriptive summary noting that call frequencies peak around noon and mid-afternoon.
However, industry leaders emphasize that generating a descriptive sentence is not equivalent to delivering a true business insight. AI models operate within the boundaries of provided data, lacking the tacit organizational knowledge, historical context, and political awareness that human managers possess.
An AI cannot inherently know that a specific afternoon spike in call volume coincides with a scheduled software patch release, nor can it ascertain that staffing levels are artificially constrained on Thursdays due to mandatory training sessions. The actionable recommendation—scheduling breaks during specific lulls—emerges only when raw analytics are synthesized with deep contextual awareness regarding who the audience is, what constraints they operate under, and which decisions fall within their sphere of control.
This paradigm underscores the principles outlined in contemporary data communication frameworks, such as specialized industry primers on AI and data storytelling. These frameworks advocate for a collaborative workflow where humans supply the necessary contextual prompts before enlisting AI assistance. While artificial intelligence excels at drafting alternative phrasings, testing vocabulary variations, and polishing sentence structures, a human expert must remain at the helm to discern what truly matters within the data.
Leveraging Tacit Knowledge in Data Presentation
Professionals who spend years working closely within specific organizational ecosystems acquire a repository of tacit knowledge that remains inaccessible to external algorithms. They understand historical precedents, internal organizational dynamics, and the shifting priorities of executive leadership. Consequently, they possess the critical judgment required to look at a volatile line graph and immediately recognize that a sharp upward movement in one metric is an operational anomaly requiring immediate intervention, while an equally dramatic fluctuation in another metric is merely seasonal noise.
Bringing this internal expertise to bear on data presentations transforms standard reporting into persuasive communication. The objective is neither verbose exposition nor radical brevity, but rather the deliberate deployment of precise language to make analytical thinking visible to stakeholders. By pairing rigorous data analysis with human-driven contextual insight, organizations can bridge the perennial gap between collecting data and driving meaningful operational change.
Related posts: