Mastering Purposeful Color in Excel Data Visualization: A Comprehensive Guide to Effective Business Reporting

In the contemporary landscape of data-driven decision-making, the ability to communicate complex metrics clearly and efficiently is a critical competency for professionals across all sectors. Whether compiling quarterly financial summaries, operational performance dashboards, or market analysis reports, data analysts and business leaders increasingly rely on digital tools and artificial intelligence assistants to generate initial graphic drafts in a matter of seconds. However, while modern software streamlines the mechanical creation of charts, it fundamentally lacks the contextual intelligence required to determine which data points matter most to a specific audience. Consequently, the responsibility of editorial curation falls squarely on the analyst, particularly regarding the strategic application of color.
When applied sparingly and purposefully, color serves as one of the most powerful instruments in explanatory communications. Rather than accepting the default rainbow palettes arbitrarily assigned by spreadsheet applications like Microsoft Excel, Word, or PowerPoint, professionals must make deliberate choices to guide their viewers’ attention. A thoughtfully constructed visual removes cognitive clutter, highlights crucial trends, and ensures that the core narrative embedded within the data is immediately apparent to stakeholders who may be reviewing the material independently.

Understanding the Foundations of Minimalist Data Design
To appreciate the necessity of intentional palette selection, one must examine the common pitfalls of default software formatting. Standard graphing utilities typically assign a distinct, highly saturated color to every individual data series or category within a chart. While this approach ensures that distinct columns or lines are visually differentiated, it creates a chaotic visual landscape. When every element on a chart fights equally for the viewer’s attention, the overall message is effectively obscured.
Data visualization experts advocate for a more disciplined approach: starting with a neutral foundation and introducing color only as an intentional spotlight. This methodology aligns with established principles of cognitive psychology, which dictate that human visual processing naturally gravitates toward contrast and saturation. By stripping away extraneous hues and building a neutral greyscale framework, an analyst establishes a clean slate that clearly communicates that the visualization is an active work in progress. Furthermore, a greyscale foundation acts as a practical safeguard, preventing the premature finalization of a graphic before the primary narrative takeaway has been firmly established.
Executing the Greyscale Transformation in Microsoft Excel
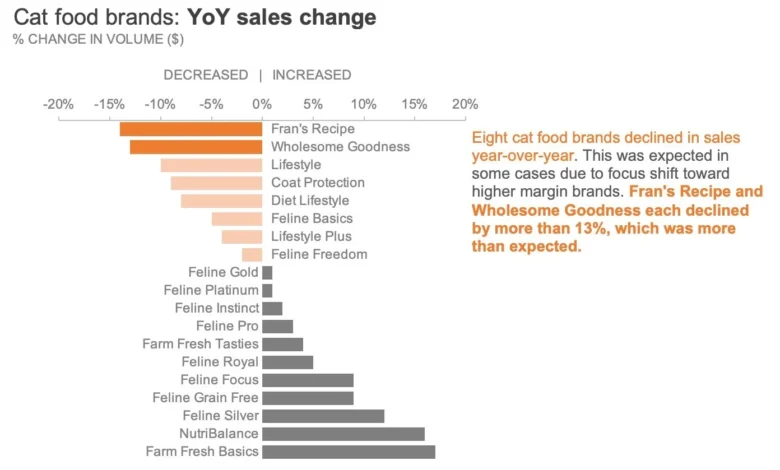
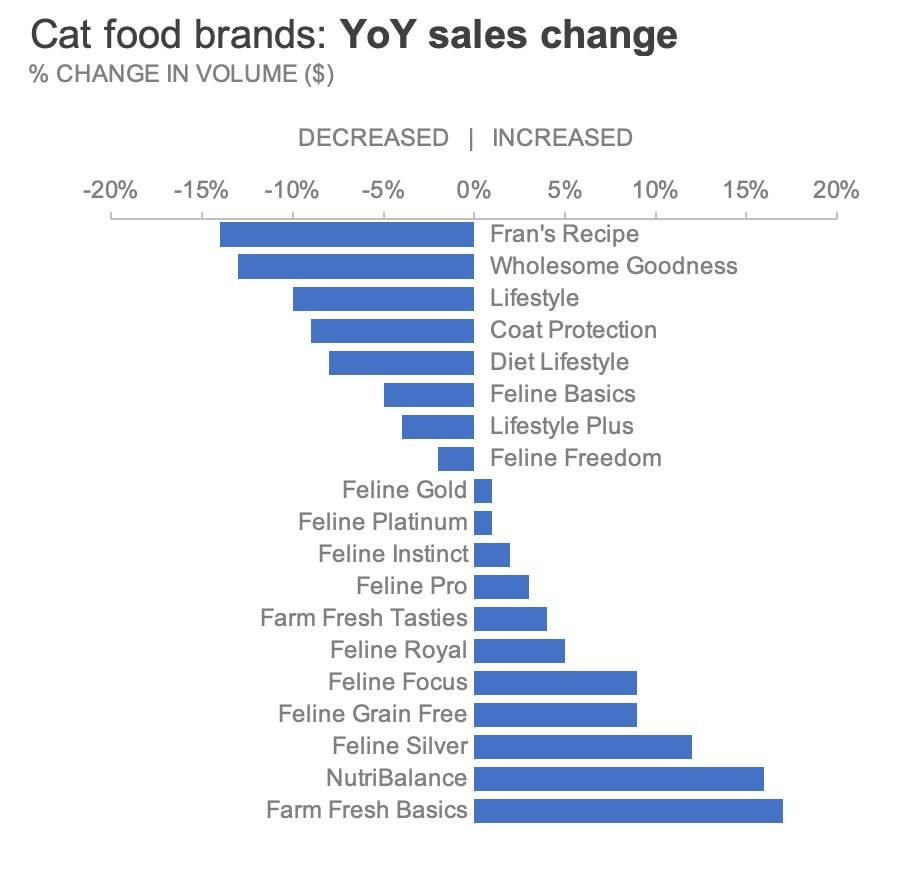
For practitioners seeking to implement this technique within the Microsoft Office ecosystem, the transformation process requires a systematic series of formatting adjustments. Using a classic case study from exercise 4.2 of the professional development text storytelling with data: Let’s Practice!—which evaluates year-over-year sales changes for various cat food brands manufactured by a leading pet care enterprise—analysts can observe the stark contrast between default outputs and refined visual designs.
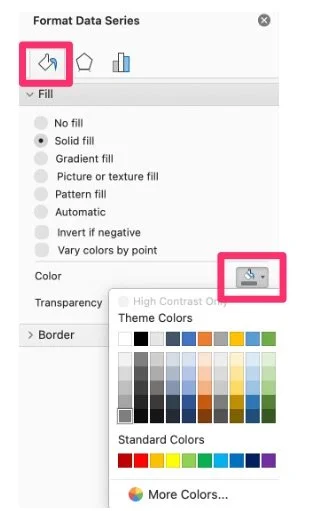
The initial step involves neutralizing the chart’s aesthetic palette. Users begin by right-clicking on the target data series within the Excel graph to open the contextual command menu, where they select the "Format Data Series" option. This action opens the Format pane on the right-hand side of the workspace. Navigating to the "Fill & Line" tab—indicated by a paint bucket icon—allows the user to modify the fill characteristics. By changing the fill setting from its default automated hue to a solid, neutral shade of grey, the entire series is instantly subdued.

In multi-series charts, this procedure must be repeated for each distinct data category until every graphical element rests upon a uniform greyscale background. To maximize long-term efficiency, experienced analysts recommend saving this standardized, clean-slate iteration as a reusable chart template within Excel. This precautionary step eliminates the need to manually execute repetitive formatting sequences for future reporting cycles, thereby streamlining organizational workflows.
Directing Viewer Attention through Strategic Highlighting
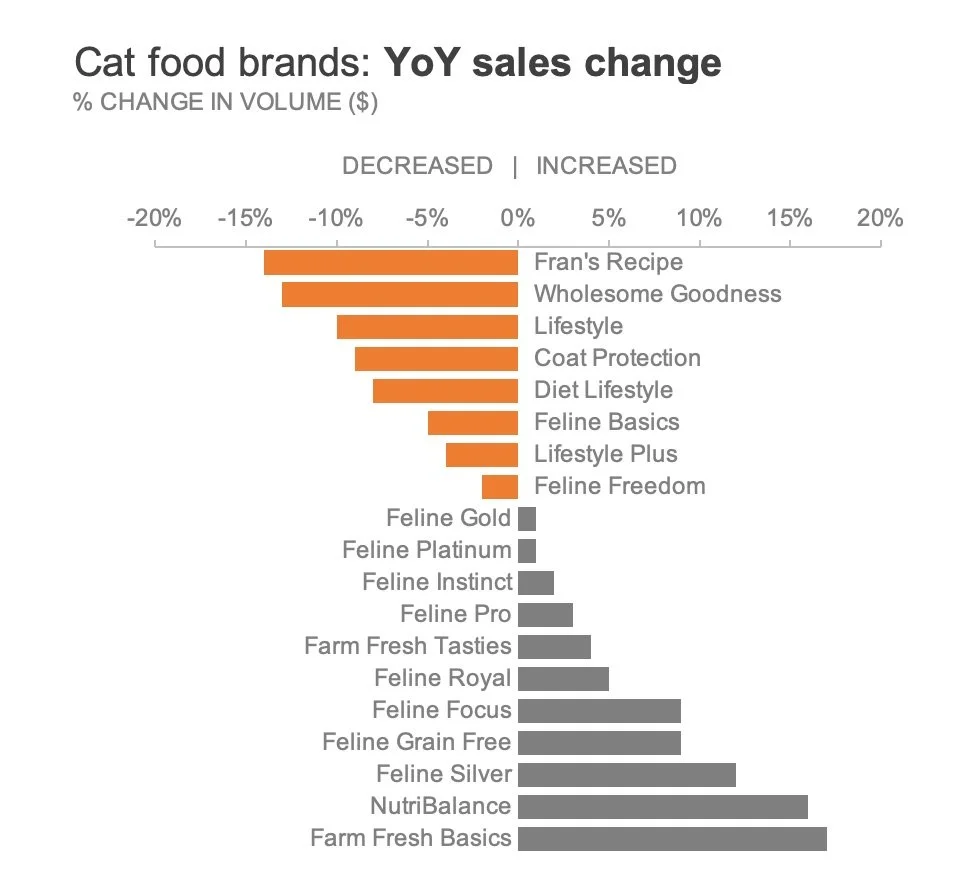
Once a neutral greyscale foundation has been established, the analyst can introduce color deliberately to emphasize specific insights. Continuing with the pet food manufacturer scenario, suppose the primary objective of the report is to draw executive attention toward the specific cat food brands that experienced a decline in year-over-year sales. Rather than coloring every bar or applying a distracting multi-color spectrum, the designer chooses to isolate only those data points representing negative growth.
Accessibility considerations play a vital role in color selection. Traditional conventions often dictate the use of bright red to signify negative performance or financial loss. However, modern accessibility guidelines emphasize that color should not be the sole indicator of meaning, particularly for individuals experiencing color vision deficiencies such as red-green color blindness. To address this concern while reinforcing negative sentiment, designers frequently select a warm, highly visible hue such as orange.
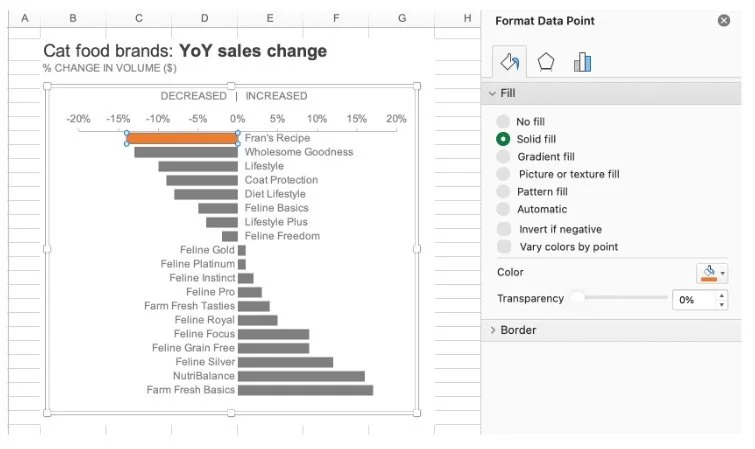
Applying color to isolated data points within Excel requires precise navigation. Because clicking on a chart element typically selects the entire data series by default, the user must click once to select the chart family, pause briefly, and then click a second time on the specific individual bar requiring modification. Right-clicking this isolated element opens the "Format Data Point" menu. Under the "Fill & Line" tab, selecting "Solid fill" enables the user to apply the chosen orange tone exclusively to that single bar.
For reports containing numerous data points that require identical formatting, efficiency shortcuts can significantly reduce production time. After formatting the first target bar, users can select subsequent bars and utilize the platform’s repeat command—pressing Command-Y on macOS or Control-Y on Windows—to rapidly apply the previous formatting action across multiple selections.
Refining Hierarchies with Nuanced Color Intensity
In complex datasets, binary distinctions—such as highlighting all negative trends versus positive ones—may prove insufficient if further granularity is required. Returning to the cat food sales analysis, suppose the analytical team needs to signal all declining brands while simultaneously drawing extraordinary focus toward the two severe underperformers: Fran’s Recipe and Wholesome Goodness.
If an analyst attempts to solve this challenge by coloring only those two severe drops in orange while rendering all other categories in grey, the broader context of overall market contraction is lost. The audience would fail to recognize the remaining declining brands that, while less catastrophic, still represent negative year-over-year performance. To preserve this crucial contextual signal while establishing a clear visual hierarchy, designers must vary color intensity.
Microsoft Excel and companion productivity suites offer at least three distinct methods for achieving this nuanced visual layering:
- Manual Palette Graduation: The designer selects a paler, less saturated shade of orange for the moderately declining brands, reserving the deep, highly saturated orange exclusively for the primary outliers (Fran’s Recipe and Wholesome Goodness).
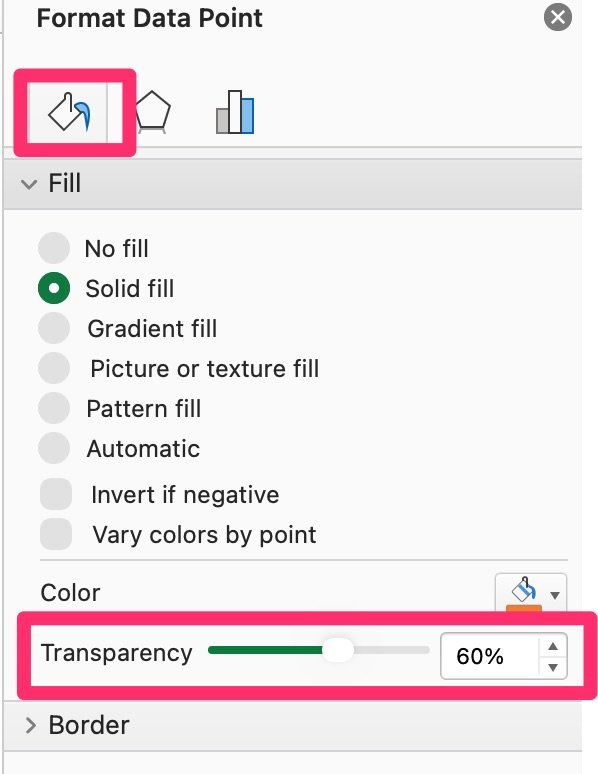
- Transparency Adjustment: Analysts maintain a uniform color hue across all declining data points but utilize the transparency slider within the Excel "Fill" menu to systematically reduce the opacity of the secondary brands, thereby visually receding them into the background while keeping the critical data points fully opaque.
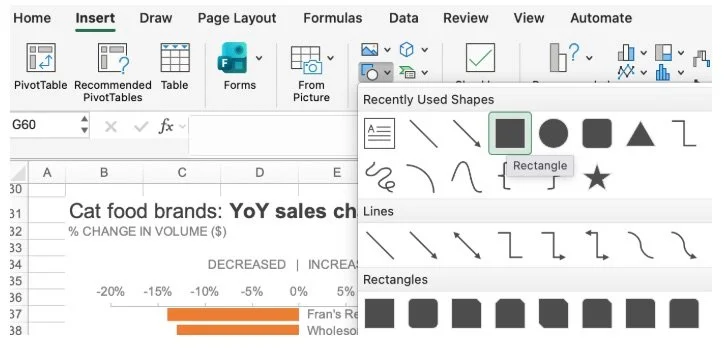
- Overlay Shape Integration: For advanced visual control, designers can insert a geometric shape—such as a semi-transparent rectangular overlay—directly above the moderately declining bars. By formatting this shape with a solid white fill, zero outline, and a carefully calibrated transparency level, the underlying bars are gracefully muted without altering the native chart data series.
Each of these techniques empowers the reporter to establish a sophisticated visual hierarchy, ensuring that the audience instantly perceives the scale and relative severity of the underlying business metrics.
Pairing Visuals with Explanatory Text for Complete Clarity
Even the most meticulously designed chart can fail if it is consumed entirely out of context. When reports are distributed via email, intranet portals, or static documents where the analyst is not physically present to narrate the findings, visual graphics must be supplemented with clear, direct explanatory text.
Best practices in data storytelling advocate for integrated text annotations placed directly adjacent to the relevant data elements. By incorporating key phrases into these annotations—and styling specific keywords in bold text matching the exact orange hue utilized in the graph—the designer creates an explicit cognitive bridge between the written word and the visual evidence. This technique, known as visual echoing, directs the reader’s eye seamlessly from the narrative takeaway to the exact data point supporting the claim, reducing interpretation time to mere seconds.
Implications and Broader Impact on Business Communication
The systematic implementation of purposeful color theory in corporate reporting carries profound implications for organizational efficiency and decision-making quality. In modern enterprises, executives and board members are routinely inundated with dense spreadsheets and overly complicated slide decks. When data communicators adopt minimalist design principles—beginning with neutral greyscale foundations, applying selective highlights, honoring accessibility standards, and integrating contextual text annotations—they fundamentally transform raw numbers into actionable intelligence.
Ultimately, color should act as a supportive architectural element rather than an ornamental distraction. By mastering tools like Microsoft Excel through disciplined formatting workflows, analysts elevate their professional output, ensuring that critical business insights are communicated with precision, authority, and undeniable clarity.