Mastering Data Storytelling and AI Integration: Designing Effective Graphs and Slides for the Modern Professional


The evolution of modern corporate communication has entered a critical juncture where data analytics, artificial intelligence, and visual design intersect to redefine how organizations share insights. As professionals increasingly rely on automated tools to process vast amounts of operational metrics, the challenge has shifted from generating data to communicating its meaning effectively. Bridging the gap between raw analytical output and compelling visual narratives requires a strategic methodology, one that balances technological efficiency with fundamental principles of human cognition and design clarity.
The transition from a preliminary concept to a polished presentation represents the most time-consuming phase of data storytelling. Whether generated through traditional spreadsheet utilities or modern generative artificial intelligence platforms, initial data visualizations rarely possess the refinement necessary for executive presentation. Without deliberate intervention, automated charts often suffer from excessive cognitive load, featuring redundant gridlines, confusing color palettes, and ambiguous titles that force audiences to decipher information rather than absorb insights. Recognizing this friction, communication experts and data strategists are adopting integrated workflows that leverage artificial intelligence not merely as an ideation partner, but as an active layout assistant within native presentation environments.
Background and Context of AI-Assisted Design
The integration of artificial intelligence into daily productivity workflows has accelerated rapidly over the past twenty-four months, moving past basic text generation into sophisticated document and presentation architecture. Historically, creating professional-grade slides required manual formatting, alignment adjustments, and iterative revisions to ensure brand compliance and visual harmony. Today, tools embedded directly into office suites—such as Microsoft Copilot in PowerPoint, alongside advanced multimodal models like Claude and ChatGPT—allow users to generate fully editable slide elements through natural language prompts.
This technological shift addresses a longstanding productivity bottleneck in corporate settings. Rather than spending hours building layouts from scratch, analysts can input raw data, contextual background, and specific audience parameters to produce an initial draft in minutes. However, industry specialists emphasize that artificial intelligence functions best as a force multiplier rather than a replacement for human judgment. The core philosophy of data storytelling emphasizes that technology can achieve ninety percent of the structural work, but the final ten percent—requiring nuanced decisions regarding emotional resonance, cultural context, and precise visual emphasis—remains the responsibility of the human creator.
Chronology of the SWD + AI Framework
The development of structured frameworks for AI-assisted data communication has followed a deliberate, multi-stage evolution designed to guide users from initial concept to final execution. This progression is encapsulated in a comprehensive series of methodological guidelines that systematically address each phase of the presentation lifecycle.
The foundational phase, established in the initial installments of the strategic series, focuses on gathering context and defining the core objective of the communication. Users are trained to articulate their "Big Idea," identify specific audience needs, and establish the baseline parameters of the business problem. Following contextual establishment, the second phase addresses narrative architecture, guiding creators through the process of structuring a logical storyline with a clear beginning, middle, and end.
The third phase transitions the narrative into visual selection, helping analysts determine whether a bar chart, line graph, scatter plot, or text callout best serves the underlying data. The current phase builds directly upon these accumulated foundations, shifting the focus entirely toward the tactical execution of graph and slide design. By utilizing specialized primers that train artificial intelligence models on established communication principles, users can bridge the gap between abstract analytical planning and concrete visual presentation.
Core Principles of Effective Graph and Slide Design
Achieving clarity in visual communication relies on four fundamental pillars: decluttering, alignment, focused attention, and intentional wording. When applied systematically, these principles reduce cognitive friction and ensure that the audience immediately grasps the primary takeaway.
Decluttering involves the systematic removal of extraneous visual elements that do not contribute to informative value. Default chart settings in many software applications automatically generate heavy borders, dense gridlines, tick marks, and redundant legends that overwhelm the viewer. By stripping away these non-essential components, the underlying data points emerge with greater clarity. Minimalism in this context is not an aesthetic preference, but a cognitive necessity designed to minimize mental processing effort.
Alignment establishes the structural backbone of a slide. When text blocks, graphic containers, and titles are misaligned by even a few pixels, viewers experience a subconscious sense of disorder that undermines the credibility of the presentation. Consistent alignment creates an invisible grid that allows the human eye to navigate information effortlessly.
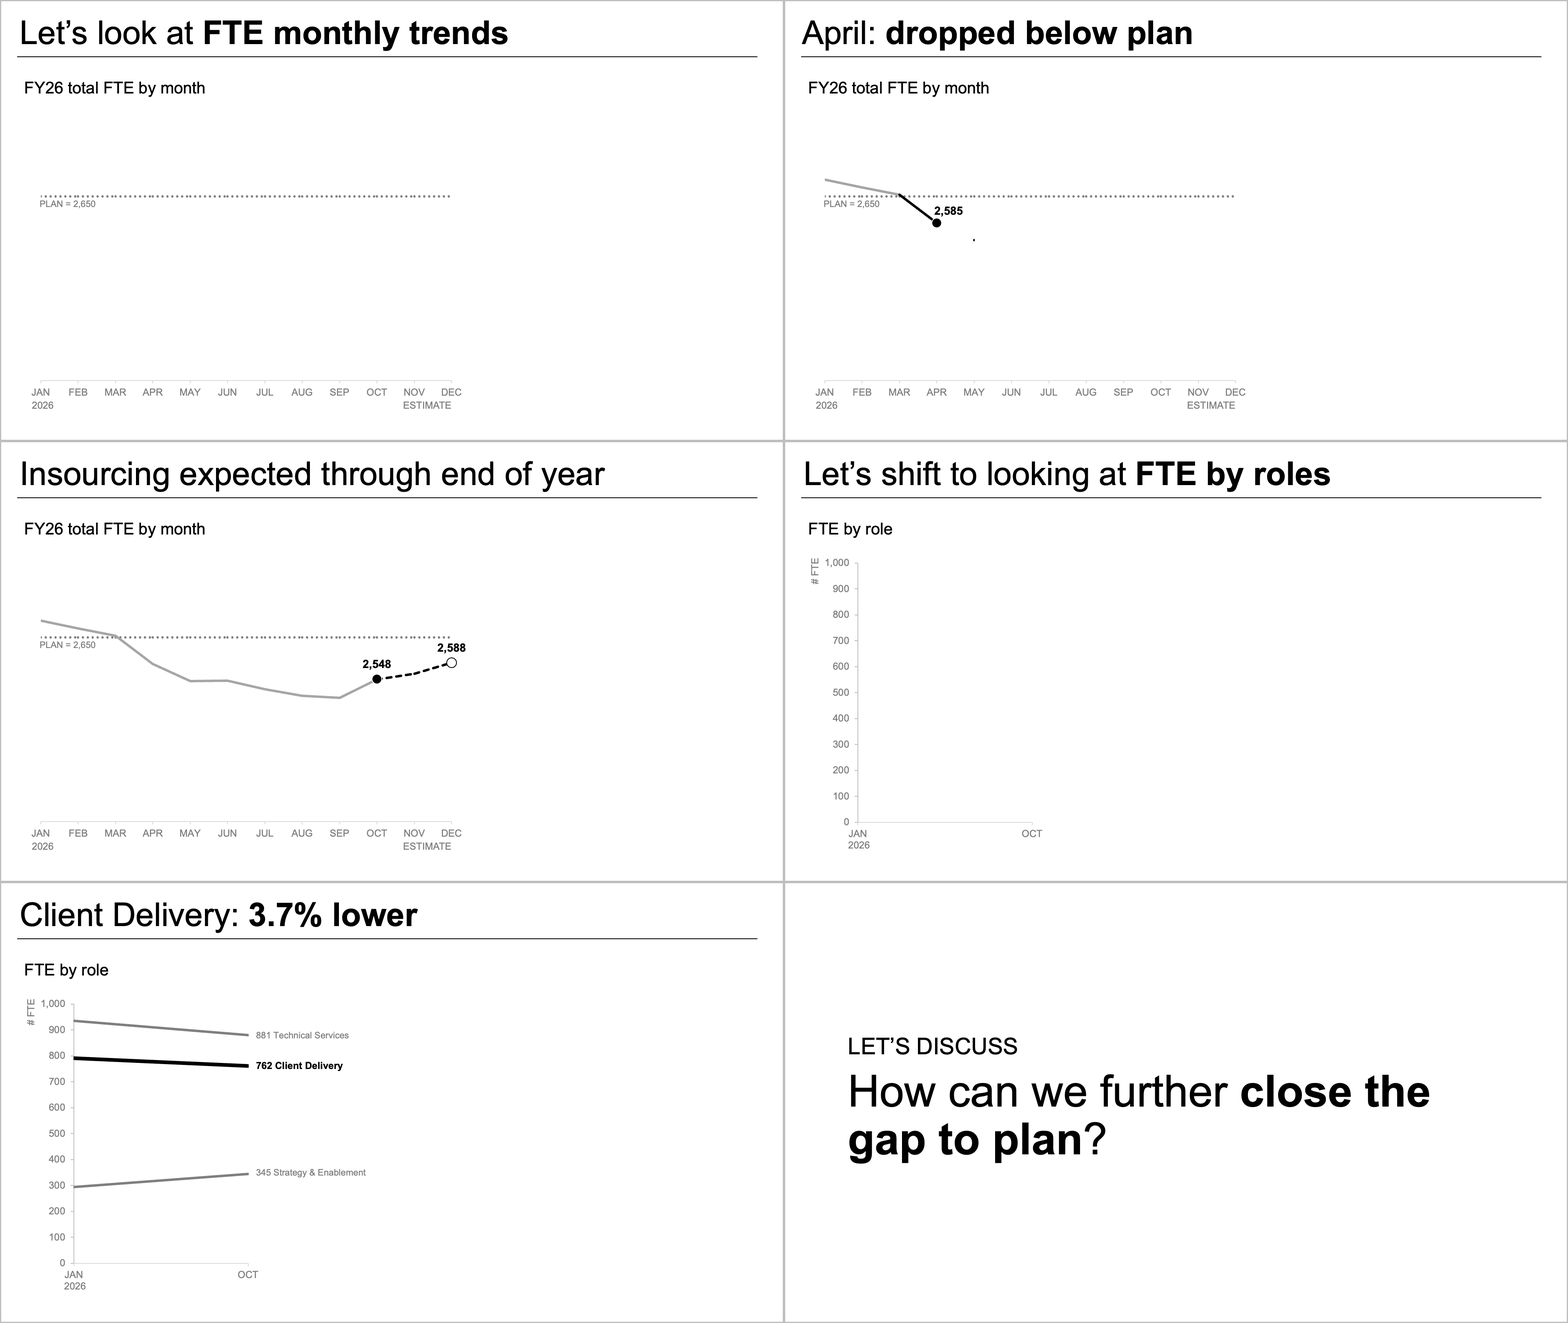
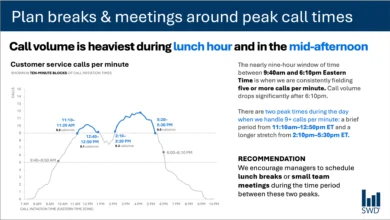
Focusing attention requires the deliberate use of visual hierarchy. Because audiences viewing a clean slide will naturally scan for points of interest, creators must actively guide the eye using strategic contrast, selective color application, and proportional sizing. By rendering secondary data in neutral tones and highlighting the primary insight with a distinct accent color, presenters can direct focus without resorting to explicit verbal commands.
Finally, the strategic use of language transforms raw numbers into actionable insights. Every visual requires a descriptive title to establish context, accompanied by a takeaway title that answers the fundamental question of relevance. Annotations applied directly to key data points further clarify the narrative without introducing unnecessary noise.
Official Responses and Industry Perspectives
Industry analysts and corporate communication directors have largely endorsed the integration of standardized design principles with artificial intelligence automation. Enterprise leadership teams note that inconsistent visual standards across departments often dilute the impact of critical business reviews. By embedding standardized frameworks directly into generative tools, organizations can enforce brand guidelines while simultaneously accelerating output.
"The greatest advantage of AI-assisted design is not merely the time saved in slide generation, but the consistency of thought it encourages," notes a senior enterprise transformation consultant. "When an analyst is forced to clearly articulate their audience, takeaway message, and contextual parameters to an AI tool, they are forced to clarify their own thinking before a single pixel is rendered."
Design professionals emphasize that adherence to corporate templates and brand guidelines remains an essential prerequisite. Visual identity markers—such as approved color palettes, typography hierarchies, and logo placements—signal organizational credibility and professionalism. Incorporating these parameters into the foundational instructions given to artificial intelligence models ensures that automated outputs remain aligned with corporate governance standards.
Broader Impact and Future Implications
The widespread adoption of AI-driven slide design carries significant implications for corporate productivity, internal communication, and decision-making efficiency. As barriers to entry for creating polished presentations diminish, organizations can expect a general elevation in the baseline quality of reporting across all operational tiers.
However, industry observers also caution against potential pitfalls, such as the uncritical acceptance of AI-generated visualizations that may misrepresent complex datasets or obscure nuances through overly aggressive simplification. The imperative for human oversight remains paramount. Analysts must continuously evaluate automated outputs for analytical accuracy, contextual appropriateness, and ethical representation of data.
Ultimately, the convergence of structured communication frameworks and advanced artificial intelligence represents a transformative shift in how organizations translate quantitative findings into strategic action. By mastering the delicate balance between automated efficiency and rigorous human curation, modern professionals can ensure their communications not only inform, but successfully move their audiences to decisive action.