The Art of Data Storytelling: Why Strategic Text and Human Insight Matter More Than Minimalist Design in Modern Corporate Communications

In the modern corporate landscape, data visualization has become the bedrock of strategic decision-making. Organizations collect petabytes of information daily, transforming raw metrics into dashboards, charts, and presentations. However, a persistent misconception has taken root across boardrooms and design agencies alike: the belief that minimalism equals effectiveness. For years, presentation designers have preached the gospel of stripping away words, assuming that a stark, unadorned graph speaks for itself. Recent communication theory and data visualization research suggest otherwise. The most successful presentations do not merely display data; they contextualize it through deliberate, purposeful copywriting that transforms passive observation into active organizational behavior.
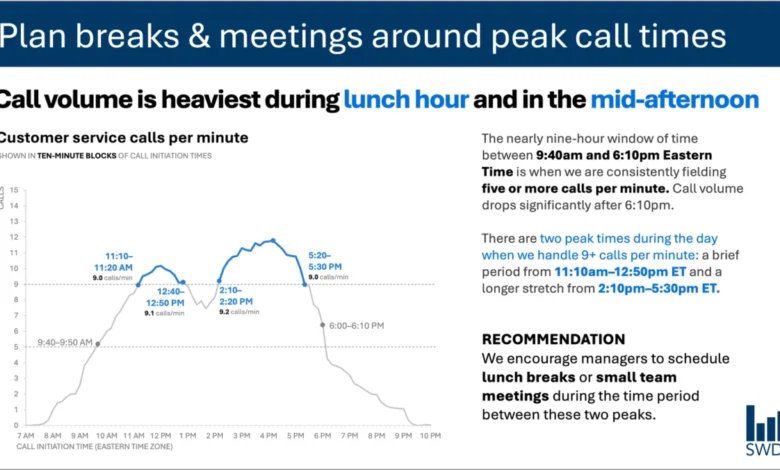
This paradigm shift is particularly evident in operational environments where managers must make real-time decisions based on complex metrics. Consider a standard customer service department tracking hourly call volumes. A raw graph plotted across a standard workday reveals a predictable rhythm: inbound inquiries surge in the morning, plateau through midday, and spike during distinct peaks around lunch and the mid-afternoon. To a casual observer, this is simply a trendline. But to a staffing manager tasked with optimizing operational efficiency, this graph represents a logistical puzzle. Without explicit context, strategic direction, and targeted annotations, the data remains inert, leaving the viewer to bridge the gap between observation and action.
Bridging the Gap Between Data and Action
When designing visual communications for operational stakeholders, every element on a slide or dashboard must serve a distinct, functional purpose. The traditional approach of letting data "speak for itself" frequently fails because numbers lack intent. Data points describe what is happening, but they rarely articulate what should be done about it.
To achieve true clarity, effective data storytelling employs a hierarchy of text elements, each assigned a specific operational role. At the apex of this hierarchy is the takeaway title—a declarative statement that moves beyond mere description to offer a strategic conclusion. For instance, rather than labeling a chart simply as "Daily Call Volume," a strategic takeaway title might read: "Plan breaks and meetings around peak call times." This immediately communicates the primary implication of the data to the viewer.
Beneath the takeaway title sits the descriptive graph title, which grounds the audience by defining the metrics clearly, such as "Customer service calls per minute." Direct labels eliminate the cognitive friction of cross-referencing a separate legend, while targeted annotations draw the eye to critical thresholds, such as the exact moments call volumes breach operational capacity. Finally, the actionable recommendation translates the visual evidence into concrete steps, advising supervisors to schedule team meetings and lunch rotations specifically during the lulls between peak periods.
This meticulous orchestration of text challenges the minimalist dogma that fewer words are always better. While removing all surrounding text creates a visually clean slide, it strips away the cognitive scaffolding the audience needs to derive value from the numbers. Effective communication is not about achieving the lowest possible word count; it is about deploying the right words to fulfill specific communicative functions.
Taxonomy of Text: Assigning Roles to Every Word
To master the integration of text and data, communicators must understand the distinct jobs that different textual components perform within a visual layout. When curating a slide or a report, creators should systematically evaluate whether every word earns its place by answering specific audience requirements.
Takeaway titles act as the intellectual anchor of the visual, communicating the core takeaway or required action. Descriptive graph titles orient the audience, establishing the parameters of the dataset without ambiguity. Direct data labels streamline comprehension, allowing viewers to process values instantaneously without glancing away from the focal point of the chart. Annotations serve as the narrative voice of the presenter, explaining anomalies, highlighting systemic shifts, and providing qualitative context that raw quantitative figures cannot convey on their own. Meanwhile, peripheral elements such as axis titles, footnotes, and source citations provide the necessary evidentiary backing for audits and rigorous analytical reviews.
Not every visualization requires the full complement of these textual tools. Overloading a simple chart with excessive annotations creates visual clutter, defeating the purpose of the graphic. The objective is intentionality. Creators must ask fundamental diagnostic questions before finalizing any visual output: What does the audience need to comprehend this baseline data? What actionable insights should they walk away with? Where might targeted phrasing eliminate ambiguity or prevent misinterpretation? Once these questions are answered, extraneous words that fail to drive the narrative forward can be systematically eliminated.
The Artificial Intelligence Frontier: Data versus Insight
As organizations increasingly turn to artificial intelligence to automate reporting and accelerate content creation, the distinction between processing data and generating genuine insight has never been more critical. Modern generative AI models possess advanced capabilities in pattern recognition and natural language generation. When fed a dataset detailing customer service call volumes, an AI model can readily identify chronological trends, note that inquiries peak during lunch and mid-afternoon, and synthesize those findings into a polished, grammatically correct descriptive sentence.
However, a polished sentence is not an insight.
True insight requires a deep, qualitative understanding of organizational context—variables that lie outside the parameters of a standard spreadsheet. An AI algorithm can detect a statistical spike, but it cannot inherently know who is viewing the chart, what pressures those managers face, which operational levers are within their control, or how historical corporate policies might influence employee behavior. Without this foundational context, an AI-generated summary remains descriptive rather than prescriptive.
This realization underpins modern data-literacy frameworks, such as the SWD (Storytelling with Data) and AI integration primers, which emphasize a collaborative workflow between human expertise and machine efficiency. Artificial intelligence excels at syntactic refinement, rapid ideation, and testing alternative phrasings for titles and annotations. Yet, the human partner remains indispensable. The human creator brings institutional memory, an understanding of interpersonal dynamics, and the nuanced judgment required to distinguish between a statistical anomaly that demands immediate intervention and a routine fluctuation that can safely be ignored.
The Irreplaceable Value of Human Context
In an era of rapid technological automation, human experience serves as the vital bridge between raw analytics and strategic execution. Professionals who spend their days immersed in operational workflows possess a tacit knowledge base that algorithms simply cannot replicate. They know why a particular metric spiked last Tuesday—perhaps due to a software outage or a sudden public relations announcement. They understand the underlying corporate culture, union constraints, or budgetary limitations that dictate how staffing schedules can be adjusted.
Bringing this localized, contextual knowledge to data visualization transforms a generic corporate presentation into a powerful catalyst for change. The ultimate goal of data communication is neither verbosity nor extreme brevity; it is precision. By marrying the computational power of modern analytical tools with the nuanced contextual awareness of human experience, organizations can ensure that every word on the page or screen is performing its rightful job, turning complex data into clear, unmistakable, and actionable intelligence.
Related posts: