Beyond the Numbers: Why Strategic Word Choice and Human Insight Define Modern Data Storytelling

The modern corporate landscape is inundated with visual data, dashboards, and automated analytics designed to streamline decision-making. Yet, organizations frequently discover that raw visualizations—no matter how meticulously designed—fail to drive meaningful operational changes. A recent evaluation of enterprise data presentation standards highlights a critical disconnect in business communication: the assumption that data speaks for itself. Industry analysts and communication strategists emphasize that numbers, charts, and graphs require deliberate, context-driven language to bridge the gap between observation and action.
This challenge has taken on renewed urgency as artificial intelligence tools increasingly automate the generation of charts and summaries. While AI can efficiently process datasets and identify macro-trends, it often stops short of generating true operational insight. To maximize the utility of business data, organizations must reevaluate how they integrate text into visual media, recognizing that every word on a slide or dashboard must fulfill a specific functional role.
The Anatomy of an Effective Data Presentation
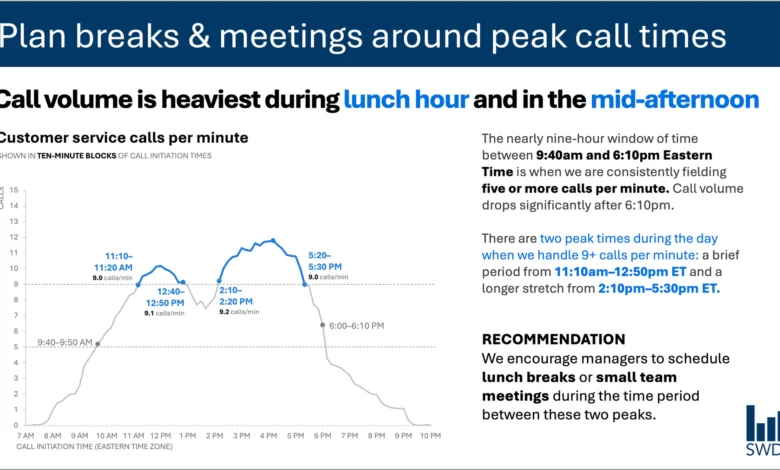
To understand the mechanics of effective data communication, consider a standard operational challenge in workforce management: customer service call volume. A typical time-series graph illustrating call volume throughout a business day reveals a predictable pattern. Calls steadily increase during the morning hours, remain elevated through much of the standard workday, and display pronounced peaks around the midday lunch hour and the mid-afternoon.
Viewed in isolation, this visualization merely presents a descriptive summary of customer behavior. However, when the target audience consists of contact center staffing managers, the fundamental purpose of the visualization shifts entirely. These managers do not review call volume charts out of idle curiosity; they examine the data to make staffing decisions, schedule breaks, and manage operational capacity.
This distinction changes how information should be presented. A minimalist approach might strip away all surrounding text, leaving only the raw graph in the name of clean design. However, communication experts argue that minimalism for its own sake degrades utility. Effective data storytelling requires an intentional architecture of text, where each component serves a distinct purpose:
- Takeaway Titles: Rather than a generic label, a takeaway title directly informs the audience of the operational implication. For example, a title such as "Plan breaks and meetings around peak call times" immediately communicates the primary takeaway.
- Descriptive Graph Titles: Labels such as "Customer service calls per minute" orient the audience and establish the parameters of the data being displayed.
- Direct Labels and Annotations: Strategic text annotations pinpoint the exact moments call volumes cross critical operational thresholds, providing vital context for the observed peaks.
- Actionable Recommendations: The final layer of text translates quantitative data into concrete directives, advising managers to schedule lunch breaks and team meetings during the lulls between peak periods.
Categorizing the Functional Roles of Text
When developing reports, dashboards, or presentation slides, communicators must assess the specific function of every textual element. Industry standards suggest breaking down text into specialized categories to avoid cognitive overload while maximizing informational value.
A takeaway title communicates the core message or required action, sparing the audience the burden of interpreting raw data independently. Meanwhile, a descriptive graph title grounds the reader, offering immediate clarity regarding the metrics and timeframes involved. Direct labeling within the body of a chart eliminates the friction of cross-referencing a separate legend, keeping the viewer’s focus centered on the data points themselves. Annotations serve a narrative function, explaining anomalies, highlighting inflection points, or adding qualitative context that numbers alone cannot convey. Finally, standard components such as axis titles, footnotes, and source citations provide the necessary rigor and traceability for institutional review.
The objective is not to incorporate every possible label, but to exercise deliberate restraint. Communicators must continually ask what the audience requires to fully comprehend the data, what actions should follow, and where concise phrasing can eliminate ambiguity. Text that does not actively contribute to comprehension or action should be systematically eliminated.
The Intersection of Artificial Intelligence and Human Insight
As organizations increasingly integrate artificial intelligence into their business intelligence workflows, the limitations of automated data interpretation have become more apparent. Modern generative AI models possess advanced capabilities in pattern recognition and linguistic synthesis. When provided with a dataset detailing customer service call volumes, an AI system can readily detect cyclical trends, note that volume peaks during lunch and mid-afternoon, and generate a grammatically polished descriptive sentence summarizing these findings.
However, a polished summary is not synonymous with an actionable insight.
True insight requires a contextual understanding that raw datasets and machine learning algorithms lack. AI operates within the confines of the provided data points, whereas human stakeholders bring institutional memory, organizational awareness, and strategic context to the analysis. A human staffing manager understands the historical factors behind a sudden spike in call volume—such as a recent product launch, a billing system outage, or a shift in corporate policy. Furthermore, human leaders know which operational levers are within their control, which budget constraints apply, and what specific performance metrics leadership prioritizes.
This dynamic underpins the framework promoted in contemporary data storytelling primers: AI must be provided with comprehensive contextual framing before it can assist effectively in communication. While artificial intelligence can serve as a powerful assistant for drafting concise copy, suggesting alternative layouts, or testing different ways to articulate a core message, it cannot replace the critical judgment required to determine what truly matters to an organization.
Chronology of Data Visualization Evolution
To appreciate the current shift toward contextual data storytelling, it is useful to examine the evolution of business analytics over the past several decades.
During the early adoption of enterprise computing in the late 20th century, data presentation was largely constrained by technical limitations. Reports consisted of text-heavy tables, ledgers, and rudimentary charts generated by mainframe systems. The primary hurdle during this era was data extraction and computation rather than visual design.
By the late 1990s and early 2000s, the proliferation of spreadsheet software and early business intelligence tools democratized chart creation. This era saw a dramatic increase in the volume of visual data produced within corporate environments. However, the ease of generating three-dimensional pie charts, complex graphs, and dense dashboards frequently resulted in "chartjunk"—cluttered visuals that obscured rather than illuminated key findings.
The subsequent decade introduced the modern data visualization movement, championed by analysts and designers who advocated for clean design, cognitive ergonomics, and data minimalism. While this movement successfully eliminated much of the visual clutter characteristic of earlier corporate reporting, it occasionally swung to an extreme where context was stripped away in pursuit of aesthetic simplicity.
In the current era, defined by big data and automated analytics, the challenge has shifted once again. Organizations no longer struggle to produce charts; they struggle to extract actionable meaning from the vast quantities of information generated daily. The integration of artificial intelligence into analytics platforms has accelerated this trend, making the synthesis of data and human context more critical than ever.
Economic and Operational Implications
The failure to effectively communicate data has tangible economic consequences for modern enterprises. Misinterpreted dashboards, poorly structured presentations, and ambiguous reports frequently lead to suboptimal resource allocation, delayed decision-making, and operational inefficiency.
In customer service operations, for instance, failing to properly contextualize call volume data can lead to chronic understaffing during peak hours and excessive idle time during lulls. This directly impacts key performance indicators such as average speed of answer, first-call resolution rates, and customer satisfaction scores. Furthermore, employee burnout increases when front-line managers are forced to navigate poorly designed operational reports without clear guidance on workload distribution.
Conversely, organizations that master the art of contextual data storytelling experience measurable improvements in operational agility. When metrics are paired with precise takeaway titles and clear actionable recommendations, teams can execute strategic adjustments rapidly. Decision-making cycles shrink, cross-functional collaboration improves, and institutional knowledge is preserved more effectively across departments.
Industry Perspectives and Expert Consensus
Management consultants and organizational communication experts increasingly emphasize that data literacy must encompass not only quantitative analysis but also qualitative narrative construction.
According to workplace productivity researchers, the average corporate employee spends a significant portion of the workday interacting with dashboards and reports. Yet, studies indicate that a substantial percentage of professionals struggle to derive clear operational takeaways from standard data visualizations. This cognitive friction represents a hidden tax on organizational productivity.
Corporate communication specialists argue that training programs must move beyond technical software proficiencies to focus on cognitive design principles. Employees at all levels—from data analysts to executive leadership—must learn how to frame data within a narrative structure that respects the audience’s time and operational priorities. As artificial intelligence assumes a larger role in generating initial drafts and analytical summaries, the premium on human judgment, empathy, and contextual awareness will only increase.
Broader Impact and Future Outlook
The ongoing evolution of data storytelling reflects a broader cultural shift in how organizations process information. As data volumes continue to expand exponentially, the competitive advantage will no longer belong to organizations that simply collect the most data, nor to those that deploy the most sophisticated automated algorithms.
Instead, success will favor enterprises that successfully bridge the gap between quantitative analysis and human understanding. This requires a disciplined approach to communication—one that rejects the false dichotomy of "more words versus fewer words" in favor of purposeful phrasing. By ensuring that every title, label, annotation, and recommendation serves a distinct functional role, organizations can transform static numbers into dynamic catalysts for action.
Ultimately, the integration of human context with machine efficiency points toward a more mature phase of business intelligence. As professionals continue to refine their approach to visual media, the focus will remain fixed on making thinking visible, eliminating confusion, and empowering decision-makers with the precise insights they need to navigate an increasingly complex operational world.