Mastering Multi-Agent Production Systems: Implementing Dual-Layer Monitoring for Quality and Infrastructure


The rapid enterprise adoption of generative artificial intelligence has shifted development priorities away from basic single-turn chatbots toward complex, multi-agent production systems capable of autonomous coordination. However, engineering teams scaling these architectures quickly discover a critical operational blind spot: traditional infrastructure monitoring tools fail to capture the unique failure modes inherent to multi-agent ecosystems. When a supervisor agent routes work to dozens of specialized sub-agents across dynamic, non-linear workflows, standard metrics like CPU utilization, memory consumption, and HTTP 500 error rates remain stubbornly green while the user experience quietly degrades.

Addressing this observability deficit requires an innovative operational paradigm. Industry developers and systems architects are increasingly turning to dual-layer monitoring strategies that simultaneously evaluate semantic output quality and underlying infrastructure health. By combining continuous conversational assessment platforms with autonomous DevOps investigation agents, modern engineering teams can identify silent regressions, trace cross-boundary execution paths, and transform unmanaged production risks into structured optimization loops.
The Anatomy of Multi-Agent Failure Modes
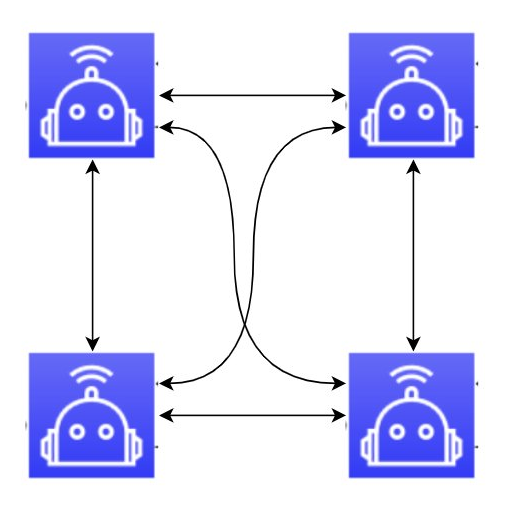
Unlike traditional microservices characterized by deterministic, tightly coupled execution graphs, multi-agent systems rely on probabilistic foundation models to govern runtime behavior. These architectures frequently implement dynamic collaboration patterns, such as the Swarm pattern, wherein a supervisor agent processes an incoming user request, formulates an execution plan, and dynamically hands off tasks to specialized peers based on intermediate findings. While this grants systems the flexibility to handle unpredictable real-world inputs, it eliminates the fixed call graphs that traditional application performance monitoring tools depend on.
Consider a multi-agent airline reservation system tasked with processing complex, multi-city travel itineraries, verifying loyalty benefits, and enforcing strict corporate travel policies within a single conversational turn. A user requesting a multi-leg flight with companion certificates and policy compliance triggers parallel operations, sequential dependencies, and external data fetches across disparate services. In such an environment, failures manifest not as catastrophic system crashes, but as subtle, insidious behavioral anomalies.

A missing AWS Identity and Access Management permission on an agent execution role, for instance, might prevent the underlying foundation model from being invoked. Rather than throwing a standard server error, the system may simply return an empty or blank response, keeping infrastructure dashboards completely green. Similarly, a supervisor agent configured with a poorly scoped prompt will not trigger error spikes; instead, it may silently route twenty percent of incoming requests to the wrong specialist agent, steadily degrading task completion rates while infrastructural metrics indicate flawless health. Furthermore, because failures can occur several steps deep into an orchestration chain without bubbling up an explicit exception, traditional logs often report successful tool executions even as the core user objective goes completely unmet.
Dual-Layer Monitoring Architecture: Quality Meets Infrastructure

To bridge this operational divide, advanced system designs deploy a complementary, two-tier monitoring architecture divided into quality assessment and infrastructure investigation.
The first layer focuses on semantic output quality and goal attainment. Using platforms such as Amazon Bedrock AgentCore Evaluations, engineering teams can continuously sample live production interactions—typically running asynchronously at configurable rates ranging from a fraction of a percent to full coverage—to score agent performance against structured rubrics. These evaluations utilize sophisticated Large Language Model-as-a-Judge frameworks alongside deterministic trajectory matchers to assess critical dimensions including helpfulness, correctness, goal success rate, response relevance, and tool parameter accuracy. By embedding these evaluations into the runtime pipeline, systems generate real-time quantitative metrics that expose silent quality drift, incorrect tool selections, and task execution failures long before they impact broader user bases.

Crucially, this asynchronous quality evaluation layer is complemented by inline safeguards such as Amazon Bedrock Guardrails. While asynchronous sampling evaluates performance after the fact to catch subtle regressions over time, guardrails operate synchronously on every single response before it reaches the user. These protective filters block harmful content, restrict out-of-scope queries, enforce contextual grounding against retrieved knowledge bases, and redact sensitive personally identifiable information such as passport details or credit card numbers. Together, inline safety guardrails and continuous quality evaluations establish a robust posture that protects real-time user trust while systematically driving long-term prompt and logic improvements.
The second tier of the monitoring architecture addresses infrastructure health through autonomous investigation. Even when semantic quality metrics remain high, underlying cloud resources, service throttlings, and security permissions are subject to transient or misconfigured failures. Leveraging autonomous tools like the AWS DevOps Agent, engineering teams can replace manual, time-consuming war rooms with automated root-cause analysis. When triggered via secure webhooks upon anomaly detection, the DevOps agent independently gathers Amazon CloudWatch logs, constructs a topology graph of affected cloud resources, and traces failures across complex service boundaries. By correlating IAM policies, runtime logs, and orchestration traces, these autonomous agents can pinpoint exactly why a blank agent response occurred, link it to a missing policy like a denied bedrock:InvokeModel API call, and generate precise, actionable remediation steps within minutes.

Chronology and Implementation of the Airline Reservation Reference Architecture
The practical execution of this dual-layer monitoring framework has been demonstrated through the deployment of a production-grade airline reservation reference system. Built using the Fullstack Solution Template for AgentCore, the application showcases how complex multi-agent topologies operate under rigorous observability constraints.

During the initial deployment phase, architects established the core agent swarm comprising a supervisor entry-point agent, a flight search specialist, a user profile and loyalty agent, and a reservation management agent. The frontend interface, developed in React and hosted on AWS Amplify, connects via Amazon Bedrock AgentCore Identity to the runtime environment, utilizing Amazon S3 for secure session storage.
As production traffic commenced, operational metrics and distributed traces were captured natively by Amazon Bedrock AgentCore Observability, which formatted the telemetry into OpenTelemetry standards and streamed it directly into Amazon CloudWatch. In parallel, AgentCore Evaluations began sampling live user sessions, piping real-time quality scores into the central monitoring dashboards.

When simulated permission faults were introduced to test the infrastructure layer—intentionally stripping the bedrock:InvokeModel permission from the execution role—the system immediately began returning blank outputs to users attempting to book flights. Traditional monitoring dashboards remained unphased, registering normal CPU and latency metrics. However, upon submitting the anomaly alert to the AWS DevOps Agent via a signed webhook, the autonomous investigation engine immediately initiated its diagnostic sequence. Within moments, the DevOps agent cross-referenced the Amazon CloudWatch logs with the resource topology, mapped the failure path from the frontend runtime down to the IAM layer denial, and delivered an exact remediation directive to update the execution role policies. Concurrently, the quality monitoring layer tracked the resulting dip in goal success rates, triggering automated pattern analysis that enabled developers to refine their agent prompts and orchestration guardrails.
Implications and Broader Industry Impact

The integration of dual-layer monitoring into multi-agent production systems marks a mature evolution in enterprise artificial intelligence operations. As organizations increasingly transition autonomous agents from experimental sandboxes into mission-critical business workflows, the tolerance for unpredictable, unmonitored failures evaporates.
The implications of this architectural pattern extend far beyond airline reservations into highly regulated sectors such as finance, healthcare, and corporate logistics, where precision, compliance, and auditability are paramount. By decoupling semantic quality assessment from infrastructure health diagnostics—while simultaneously fusing them into a unified, continuous feedback loop of monitor, analyze, improve, and deploy—enterprises can finally achieve the operational visibility necessary to scale autonomous systems with confidence.

Ultimately, mastering production artificial intelligence requires looking beyond traditional server metrics to evaluate what the agent actually understood and whether the user’s intent was genuinely fulfilled. Through comprehensive dual-layer observability, engineering organizations can transform opaque runtime behaviors into quantifiable insights, ensuring that multi-agent systems remain secure, reliable, and continuously aligned with enterprise objectives.