Data Visualization Community Launches Global Challenge Focused on Waterfall Charts for August

The intersection of geographic exploration and data analytics has provided the inspiration for the latest installment of the Storytelling with Data (SWD) global community challenge. Announced for the month of August, the new initiative invites data analysts, visualization professionals, and enthusiasts from around the world to design, refine, and submit professional-grade waterfall charts. Drawing a parallel between the rugged landscape of the Pacific Northwest—home to more than 2,900 waterfalls, including the tallest in the continental United States—and the structural mechanics of cumulative data visualization, organizers are encouraging participants to explore new ways to visually represent sequential data changes.
The challenge calls on contributors to utilize their own datasets, leverage publicly available information, or reinterpret classic examples provided by the SWD platform. Submissions are officially open through August 31 at 5:00 PM Pacific Time via the organization’s community portal. With data security and privacy remaining a cornerstone of modern analytics, participants handling proprietary information have been explicitly reminded to properly anonymize sensitive metrics before publication.
Understanding the Mechanics and Utility of Waterfall Charts
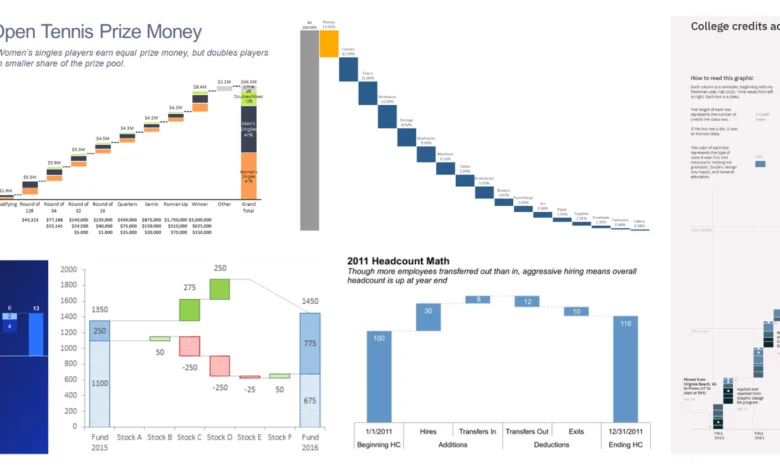
Waterfall charts occupy a specialized and powerful niche within the broader ecosystem of business intelligence and data visualization. Unlike standard bar charts or line graphs that primarily track point-in-time metrics or continuous trends over time, waterfall charts are explicitly designed to illustrate how an initial baseline value is affected by a series of intermediate positive and negative adjustments, ultimately resulting in a final net value.
In corporate finance and commercial strategy, these charts have long served as a standard tool for variance analysis, explaining shifts in net income, gross margin discrepancies, or year-over-year revenue growth by isolating specific cost drivers and revenue streams. However, the versatility of the format extends far beyond traditional financial accounting. Human resources departments frequently employ modified waterfall diagrams to track workforce attrition and recruitment pipelines, visualizing how baseline headcounts fluctuate due to hires, promotions, resignations, and retirements over a specific quarter or fiscal year.
Furthermore, product management and subscription-based business models rely heavily on these visual aids to evaluate customer acquisition and churn. By mapping the starting subscriber count, adding new sign-ups, and subtracting cancellations and downgrades, organizations gain an immediate visual narrative of net growth. Even non-traditional sectors utilize the format; sports analytics professionals have adapted the framework to track score variations or momentum shifts over the course of a competitive match, demonstrating the chart’s broad communicative flexibility.
Chronology and Evolution of the SWD Community Challenges
The launch of the August waterfall chart challenge represents the continuation of a structured, long-term educational initiative pioneered by the Storytelling with Data platform. Founded by data visualization expert and author Cole Nussbaumer Knaflic, the community has grown into a vast international network dedicated to improving how quantitative information is communicated across industries.
The conceptual framework of monthly data challenges was established to bridge the gap between theoretical knowledge and practical execution. Over the years, the platform has hosted dozens of themed challenges covering diverse analytical subjects, ranging from effective dashboard design and color theory to specialized formats like slopegraphs, scatter plots, and, in earlier iterations, introductory explorations of waterfall charts.
The decision to revisit the waterfall chart format after several years stems from evolving industry standards and the demand for more dynamic, narrative-driven data communication. While previous iterations focused primarily on foundational mechanics, the current challenge places heightened emphasis on contextual storytelling, cognitive load reduction, and the optimization of white space in written and presented reports. Organizers noted that modern data professionals face increasing pressure to deliver insights rapidly, making formats that facilitate live walkthroughs and executive summaries exceptionally valuable.
Design Considerations and Best Practices for Analysts
Constructing an effective waterfall chart requires adherence to rigorous visual design principles to prevent misinterpretation. Because these charts rely heavily on color coding—traditionally green or blue for positive increments and red or orange for negative decrements—analysts must ensure that their color palettes remain accessible to individuals with color vision deficiencies.
Another critical design factor involves the handling of subtotals and intermediate summary bars. Unlike standard floating columns that depict standalone increments, summary bars must originate from the baseline axis to provide a clear anchor point for the viewer’s eye. Failure to properly anchor these columns can distort the perceived magnitude of intermediate changes, leading to erroneous conclusions by stakeholders.
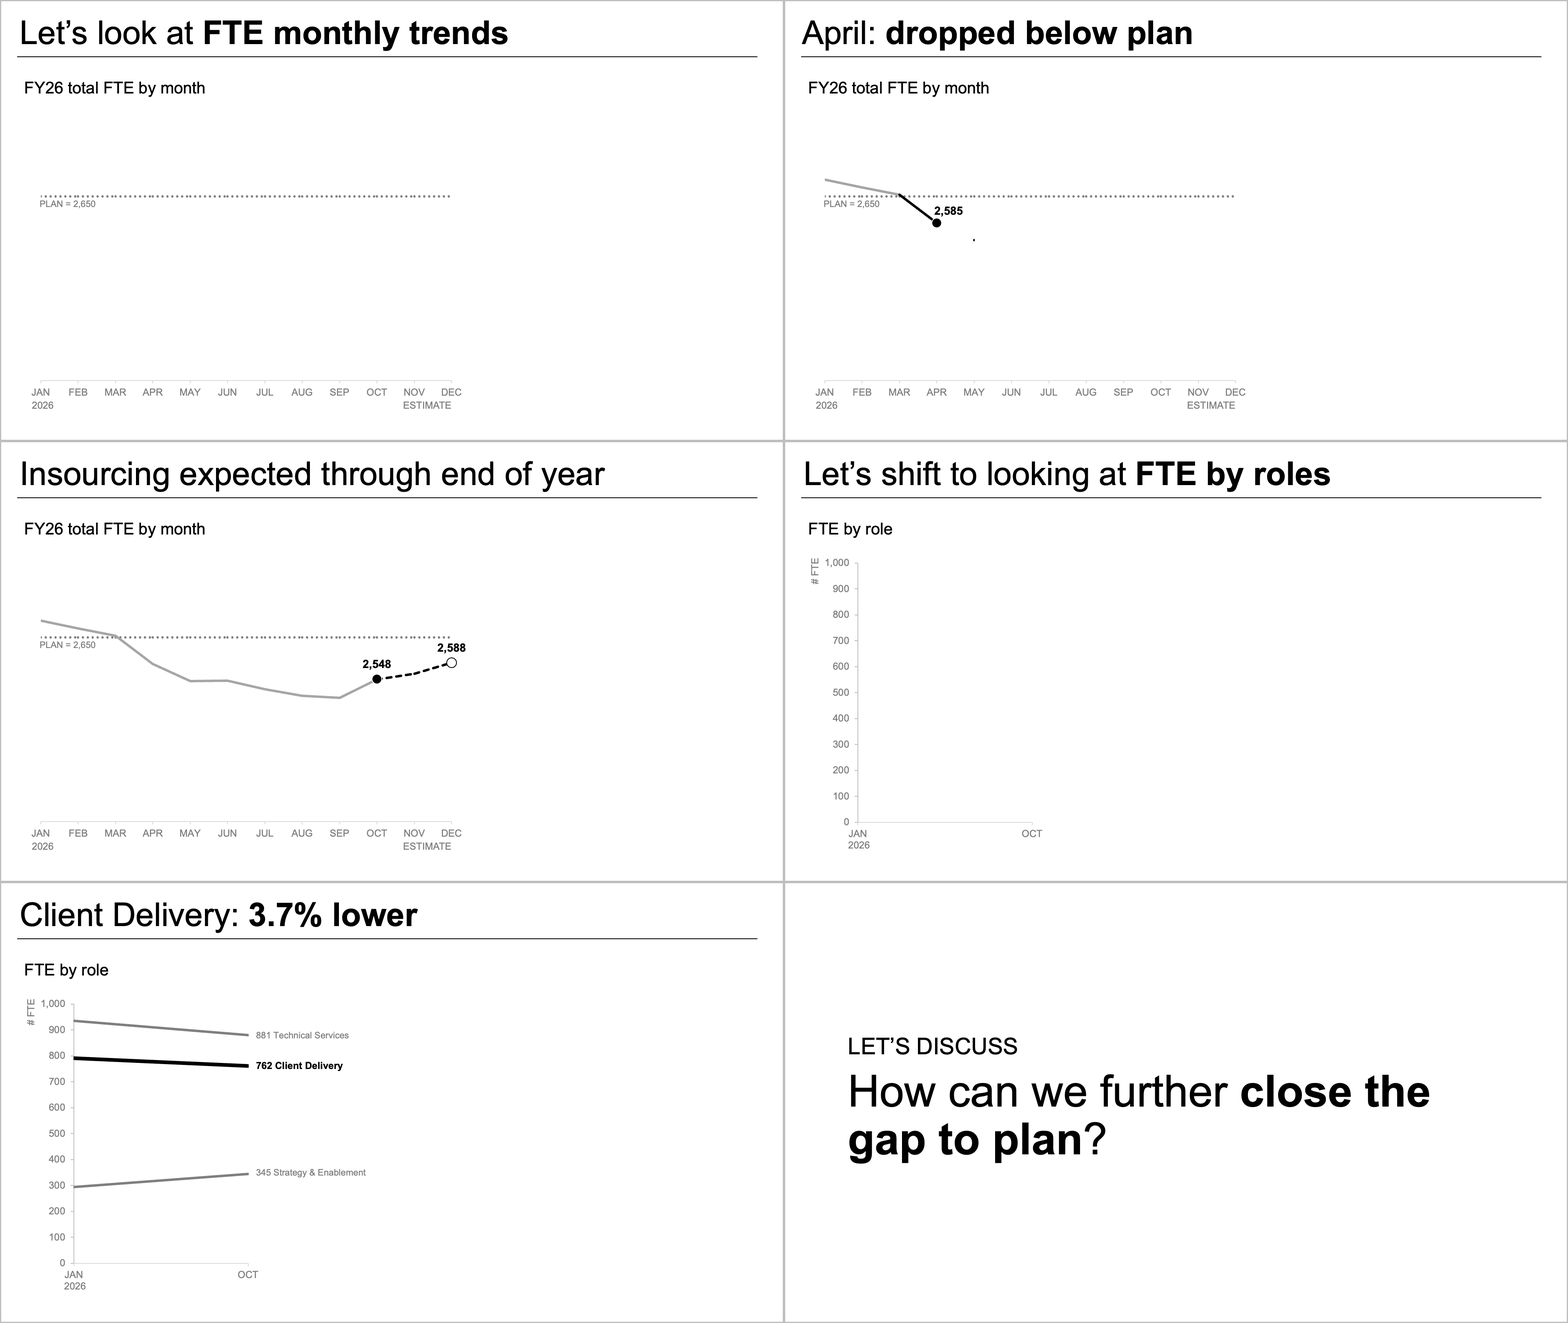
Additionally, experts emphasize the importance of strategic labeling and narrative flow. When deployed in live presentations, waterfall charts allow presenters to guide audiences through complex financial or operational narratives, pausing to discuss specific inflection points or unexpected cost drivers in the middle of the sequence. In static reports or written communications, the deliberate use of white space surrounding the chart helps direct attention to the most critical takeaways, minimizing clutter and enhancing overall comprehension.
Broader Industry Implications and Data Governance
As data-driven decision-making becomes ubiquitous across all tiers of modern enterprise, the ability to translate complex numerical metrics into intuitive visual narratives is increasingly recognized as a vital professional competency. Initiatives like the SWD monthly challenges highlight the ongoing industry-wide shift away from dense, impenetrable spreadsheets toward transparent, human-centric data communication.
Concurrently, the emphasis on data anonymization within the challenge guidelines underscores the growing importance of data privacy, compliance, and ethical governance. With global regulations such as the General Data Protection Regulation (GDPR) and the California Consumer Privacy Act (CCPA) enforcing strict controls over personal and corporate data handling, analysts must remain vigilant in ensuring that shared case studies do not inadvertently expose proprietary intellectual property or personally identifiable information (PII).
Looking ahead, participants who submit their visualizations by the August 31 deadline will have the opportunity to receive peer reviews, expert feedback, and community engagement through the online portal. By fostering an environment of collaborative learning and iterative improvement, the challenge aims to elevate the standard of visual communication not only within dedicated data teams, but across cross-functional departments ranging from marketing and sales to executive leadership and public policy.