Python 3.15 Introduces Tachyon: A Built-In Sampling Profiler Revolutionizing Production Performance Optimization

The Python software ecosystem is undergoing a major paradigm shift in performance monitoring and code optimization. Historically, identifying bottlenecks in production Python applications required a difficult choice between two imperfect options: utilizing tracing profilers that crippled application speed by two to three times, or relying on fragile third-party tools that frequently broke with every new runtime release. This long-standing industry challenge is officially being resolved with the upcoming release of Python 3.15, which natively integrates Tachyon, a high-performance sampling profiler built directly into the standard library. Designed to attach to live production applications with virtually zero overhead, Tachyon promises to eliminate guesswork, streamline diagnostics, and bring enterprise-grade observability to every Python developer without requiring external dependencies.
The Architectural Evolution: From Tracing to Sampling
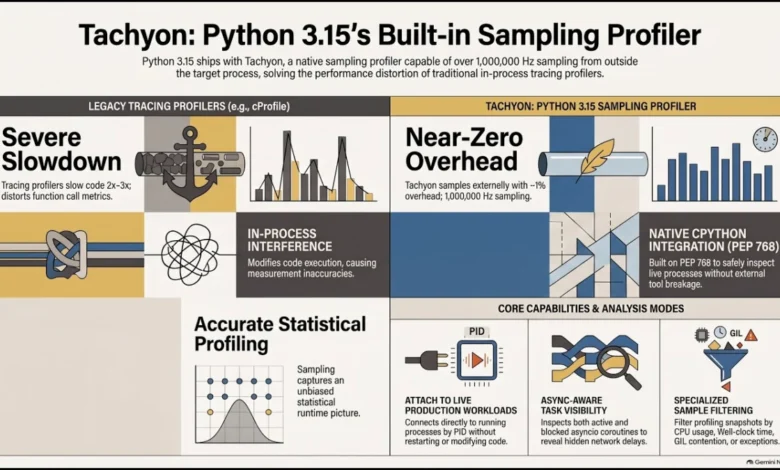
To understand the profound significance of Tachyon’s integration, one must examine the limitations of legacy Python profiling tools. Traditional tools like profile and cprofile function as tracing profilers. While these utilities offer meticulous accuracy by logging every single function call and return within an application, they introduce a massive performance penalty. Because tracing profilers execute logging code synchronously alongside the target application, they routinely slow execution down by 200% to 300%. In heavily recursive or function-heavy codebases, the overhead can be even higher, making tracing profilers fundamentally unusable in high-throughput production environments. Furthermore, because these profilers alter runtime behavior and disproportionately penalize internal function-heavy workloads, the resulting data can frequently misrepresent actual application performance—a phenomenon akin to the observer effect in physics.
Third-party sampling profilers like Py-Spy and Austin attempted to bypass these runtime penalties by inspecting Python processes from the outside. By periodically capturing call stacks via external operating system mechanisms, these tools could sample running applications without modifying their internal execution paths. However, external profilers face a different major hurdle: they depend on undocumented, internal CPython runtime structures. Every time the CPython core team modifies internal interpreters, memory management, or object layouts for performance gains—such as the massive optimizations introduced in Python 3.11 and 3.12—external profilers break. Developers frequently found themselves unable to upgrade their runtime environments because their monitoring and profiling toolchains lagged behind core CPython developments.
Tachyon bridges this architectural divide. By building a high-frequency sampling profiler directly into the CPython standard library under PEP 768 and PEP 799, the Python core development team has ensured that the profiling tool evolves synchronously with the interpreter itself.
The Engineering Journey: From Two Samples a Second to a Million Hertz
The development of Tachyon represents a masterclass in systems engineering, spearheaded by CPython core developer and Steering Council member Pablo Galindo Salgado, alongside Laszlo Kiskoller from Bloomberg’s Python infrastructure team. The project originated as an experimental initiative during a developer sprint at PyCon, where the initial prototype achieved a meager sampling rate of just two samples per second. At that performance level, the utility was virtually non-existent for modern high-speed workloads.
Recognizing the immense potential of a native sampling engine, Galindo Salgado and Kiskoller spent the duration of the sprint ruthlessly optimizing the prototype’s interaction with the CPython runtime. Through architectural refinements, memory-efficient data structures, and deep integration with CPython’s internal execution state, the performance scaled exponentially. By leveraging new external debugger interfaces standardized under PEP 768, the final production-ready implementation of Tachyon is capable of sampling at frequencies exceeding one million hertz.
Despite this astronomical sampling rate, Tachyon maintains an astonishingly low resource footprint. Under default operating configurations—typically set between 100 and 1,000 samples per second—the runtime performance penalty on the target application remains negligible, usually fluctuating between 1% and 2%. Even when driven to extreme limits of tens of thousands of samples per second, the overhead remains a fraction of legacy tracing profilers, allowing engineering teams to keep sampling mechanisms active in staging and production environments continuously.
Core Capabilities and Advanced Diagnostic Modes
Tachyon is not merely a faster drop-in replacement for legacy profiling utilities; it is a comprehensive diagnostic suite designed to tackle the multifaceted complexities of modern software architectures. Standardized under the new profiling package alongside a streamlined tracing module, Tachyon provides deep insights through specialized operational modes tailored for complex software paradigms:
- Wall Clock vs. CPU Time Filtering: Tachyon allows developers to isolate actual computational workloads from idle waiting periods. While wall clock mode measures absolute elapsed time—capturing network latency, disk I/O, and artificial sleep states—CPU mode filters out idle time, directing developer attention exclusively toward active instruction processing and algorithmic inefficiencies.
- Asynchronous Concurrency and Event Loop Profiling: Modern Python applications heavily rely on
asyncioand event-driven architectures. Traditional profilers struggle to accurately attribute execution time across asynchronous task switches. Tachyon natively supports asynchronous coroutine profiling, providing visibility into both currently running tasks and pending tasks blocked in the event loop queue. This allows engineers to instantly pinpoint bottlenecks in distributed web frameworks and high-concurrency microservices. - Thread and GIL Contention Analysis: With the ongoing introduction of free-threaded Python (PEP 703) and the removal of the Global Interpreter Lock (GIL), multi-threaded performance debugging has become paramount. Tachyon includes specialized execution modes to monitor GIL acquisition, thread scheduling, and synchronization bottlenecks, helping teams diagnose concurrency deadlocks and scaling limitations.
- Exception and Opcode Diagnostics: Advanced debugging modes allow developers to track the performance impact of exception handling and low-level bytecode execution. Because Python exceptions can inadvertently introduce massive overhead when misused in tight iteration loops (such as iterator exhaustion protocols), exception-frequency profiling provides a powerful diagnostic lever for codebase-wide optimization.
- Visualization and Live Telemetry: Tachyon ships with robust reporting mechanisms out of the box, capable of generating modern flame graphs, differential performance comparisons between code commits, and real-time live terminal views reminiscent of system monitoring utilities like
top.
Industry Implications and Future Outlook
The introduction of Tachyon in Python 3.15 marks a watershed moment for enterprise Python adoption. In data-intensive domains such as financial technology, high-frequency trading, and large-scale machine learning infrastructure, performance optimization has traditionally required migrating critical loops to lower-level languages like C++ or Rust. By providing near-zero-overhead production profiling directly within the standard runtime, Python empowers developers to identify and resolve performance regressions in native Python code before resorting to complex rewrites.
Industry heavyweights have already begun internal testing of high-frequency sampling architectures. Early deployments across massive institutional infrastructure have demonstrated the profound financial and computational impact of real-time profiling, successfully uncovering subtle algorithmic inefficiencies—such as accidental quadratic time complexities hidden deep within legacy codebases—that traditional monitoring tools entirely missed.
As Python continues its aggressive trajectory toward higher execution speeds—bolstered by the Faster CPython initiative, ongoing JIT compiler developments, and experimental free-threading capabilities—observability must scale in parallel. With Tachyon landing in Python 3.15, the Python software foundation has delivered a foundational tool that ensures developers no longer have to guess why their applications are slow. They can measure them live, at full speed, and with absolute precision.
Related posts: