The intersection of generative artificial intelligence and corporate data analysis has reached a new maturity level, shifting from simple text generation to the sophisticated synthesis of structured datasets into boardroom-ready visual presentations. As organizations grapple with an increasing volume of business intelligence, the bottleneck in decision-making often resides not in the gathering of data, but in the time-consuming process of translating raw figures into coherent, narrative-driven slide decks. New tools, such as the AI-powered presentation suite from Julius, are now enabling analysts to bridge the gap between complex Excel workbooks and PowerPoint presentations with unprecedented efficiency.
The Evolution of Data-Driven Storytelling
For years, the industry standard for reporting—specifically quarterly business reviews—has remained largely manual. Analysts typically spend hours extracting data from CRM platforms or ERP systems, porting them into Excel for cleaning and calculation, and then manually mapping those findings into PowerPoint slides. This traditional workflow is prone to human error, particularly when updating figures or adjusting chart formatting.
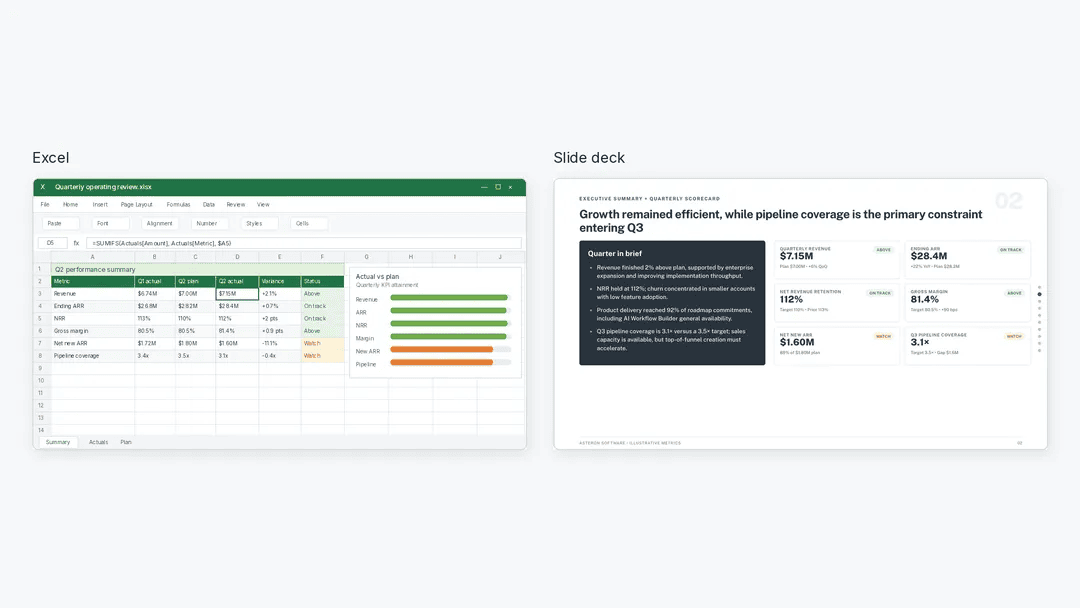
The integration of AI into this pipeline represents a paradigm shift. Rather than relying on manual copy-pasting, modern AI tools utilize large language models combined with computational engines to interpret data structures, verify mathematical relationships, and generate visual outputs. This transition is becoming essential as businesses demand higher-frequency reporting cycles and more granular insights from their marketing, financial, and operational teams.
Establishing a Methodological Framework for AI Analysis
The deployment of AI for corporate reporting requires a disciplined, multi-stage approach to ensure accuracy and compliance. Industry experts advise that the process should not be a "black box" operation; instead, it must follow a rigorous, five-step verification cycle to maintain data integrity.
1. Defining the Analytical Objective
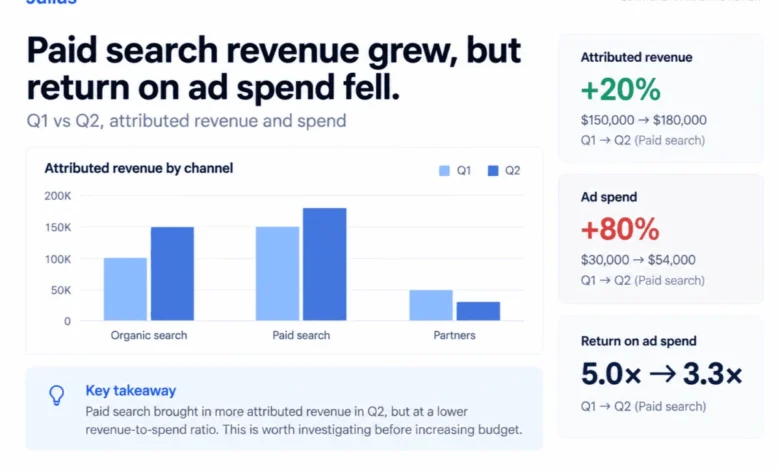
The most significant error in AI-driven analysis is the lack of a clear prompt or objective. Asking an AI to "create a marketing presentation" often results in generic, low-value outputs. Instead, leadership teams are encouraged to define specific business questions. For instance, determining how revenue shifted across marketing channels between Q1 and Q2 requires identifying the key metrics—attributed revenue, spend, and return on ad spend (ROAS)—before the AI begins its work. By establishing a clear scope, analysts ensure the resulting presentation is not merely a collection of charts, but a strategic response to a specific business inquiry.
2. Data Integrity and Structural Verification
Before any visualization occurs, the underlying data must be validated. AI tools like Julius allow users to upload Excel or CSV files and perform a preliminary inspection. This phase is critical for identifying common data issues:
- Duplicate Records: Removing redundant entries that could artificially inflate performance figures.
- Ambiguity Resolution: Clarifying terms like "revenue," which can vary between booked revenue, cash collections, or pipeline estimates.
- Cross-Tabulation: Ensuring that calculations across different tabs—such as Revenue and Paid Search Spend—are aligned by time periods and identifiers.
Professional analysts emphasize that AI should be treated as a computational assistant rather than an autonomous authority. During this stage, users should explicitly instruct the tool to flag missing values or anomalies without making adjustments, allowing for a human-in-the-loop review.
3. Rigorous Computational Validation
Once the data is deemed clean, the analytical phase begins. A critical aspect of this stage is comparing AI-generated calculations against a "source of truth" or reference dataset. For example, in a marketing review, calculating the percentage change in revenue across channels—such as organic search, paid search, and partnerships—must be verified.
In a typical scenario, if Organic search revenue grew by 50% ($100,000 to $150,000) and Paid search grew by 20% ($150,000 to $180,000), while Partners declined by 40% ($50,000 to $30,000), the total revenue increase of 20% must be mathematically consistent. Furthermore, calculating the return on ad spend (ROAS) is essential for identifying potential inefficiencies. If spend increased by 80% while revenue grew by only 20%, the ROAS decline—from 5.0x to 3.3x—is a critical insight that must be highlighted for leadership.
4. Constructing the Narrative Brief
With verified data in hand, the transition to the presentation format involves a structured "briefing" process. AI tools perform best when provided with specific constraints regarding the audience, the time allotted, and the desired tone. A well-constructed prompt for a 10-minute executive presentation might include:
- The "Takeaway" Requirement: Instructing the AI to use actionable titles for each slide (e.g., "Paid search efficiency declined despite revenue growth").
- Visual Constraints: Specifying the type of charts (grouped bar charts, trend lines, or tables) to best represent the data.
- Disclaimer Inclusion: Ensuring that the deck explicitly states data limitations, such as the lack of margin data or external market factors.
This step effectively turns the AI into a presentation designer, ensuring that the visual output is not just aesthetically pleasing but logically sound and anchored in the verified data.
5. Post-Export Quality Assurance
The final step in the lifecycle of an AI-generated presentation is the manual review of the exported PowerPoint file. While AI tools are highly capable, they can occasionally struggle with complex formatting or layout nuances. Analysts should verify that all charts are readable, that source notes are properly attributed, and that the narrative flow is coherent. If a slide requires adjustment, the process should involve targeted, iterative feedback to the AI, such as: "Revise the paid search slide to highlight the spend-to-revenue ratio without implying profitability improvements."
Broader Implications for Corporate Productivity
The adoption of AI-enabled reporting tools has profound implications for corporate productivity. By automating the "grunt work" of data cleaning, calculation, and slide creation, organizations can allocate more human capital to high-level strategic interpretation. Instead of spending 80% of their time on data assembly, analysts can focus on the remaining 20%—the actual "so what" of the data.
However, this transition also highlights the growing need for data literacy. As AI lowers the barrier to entry for creating professional-grade presentations, the responsibility of the analyst shifts toward ensuring that the underlying assumptions are correct. In a world where an AI can generate a chart in seconds, the value lies in the human capacity to ask the right questions and challenge the AI’s conclusions.
Furthermore, these tools are fostering a culture of "version control" and reproducibility. Because the analysis is documented through prompts and source files, future updates to the data can be processed significantly faster, allowing for real-time reporting that was previously too resource-intensive to maintain.
Conclusion: The Future of Data Reporting
As AI continues to integrate into the standard toolkit of the modern office, the role of the data analyst is being redefined. The shift from manual slide creation to AI-assisted synthesis is not merely an incremental change in speed; it is a fundamental transformation of how business insights are disseminated. By adhering to a process that prioritizes data verification, clear logical frameworks, and iterative refinement, organizations can leverage these tools to drive better, faster, and more informed decision-making at every level of the enterprise. As these technologies evolve, the competitive advantage will go to those who can best balance the raw computational power of AI with the nuanced, strategic oversight of the human analyst.